Covid truth is VERY hard to find.
From extensive research, we have discovered many false statements and reports.
BUT, fortunately, England has gathered Covid and "Delta variant" data that helps us discover the truth.
The information below may appear shocking!
Latest information from England not only confirms our earlier efforts but also helps overcome some of the MASSIVE amount of mis-information out there in the world.
False "Fact" 1.): The pandemic is only among the unvaccinated.
The charts and data below show the exact opposite of this supposed "FACT". This data comes directly from Official United Kingdom Reports, ..that you can OBTAIN and CHECK for yourself.
False "Fact" 2.): Breakthrough infections are "rare".
"Breakthrough Infections" are actually quite common. In fact the percentage of total Covid infections almost perfectly mirrors the percentage of vaccinated people.
False "Fact" 3.): The "Unvaccinated" are almost 100% of those "Dying from Covid".
Fully vaccinated people are still dying from Covid infections. In some age groups, the "Fully Vaccinated" are dying from Covid at GREATER RATES than the unvaccinated. Again, this data comes directly from Official United Kingdom Reports, ..That you can OBTAIN and CHECK.
False "Fact" 4.): Covid Hospitalizations and Death are prevented by being "Fully Vaxxed".
Fully vaccinated people make up a large share of those hospitalized overnight or who die from Covid infections. In some age groups, the "Fully Vaccinated" are hospitalized from Covid at GREATER RATES than the unvaccinated. As before, this data comes directly from Official United Kingdom Reports, ..that you can OBTAIN and CHECK.
Covid infection rates are nearly identical to the rates of vaccinations
If the vaccines worked as promised, "breakthrough infections" would truly be rare.
The chart below gives good comparisons to see how CLOSELY the infection rate mirrors the actual percentage of the people vaccinated.
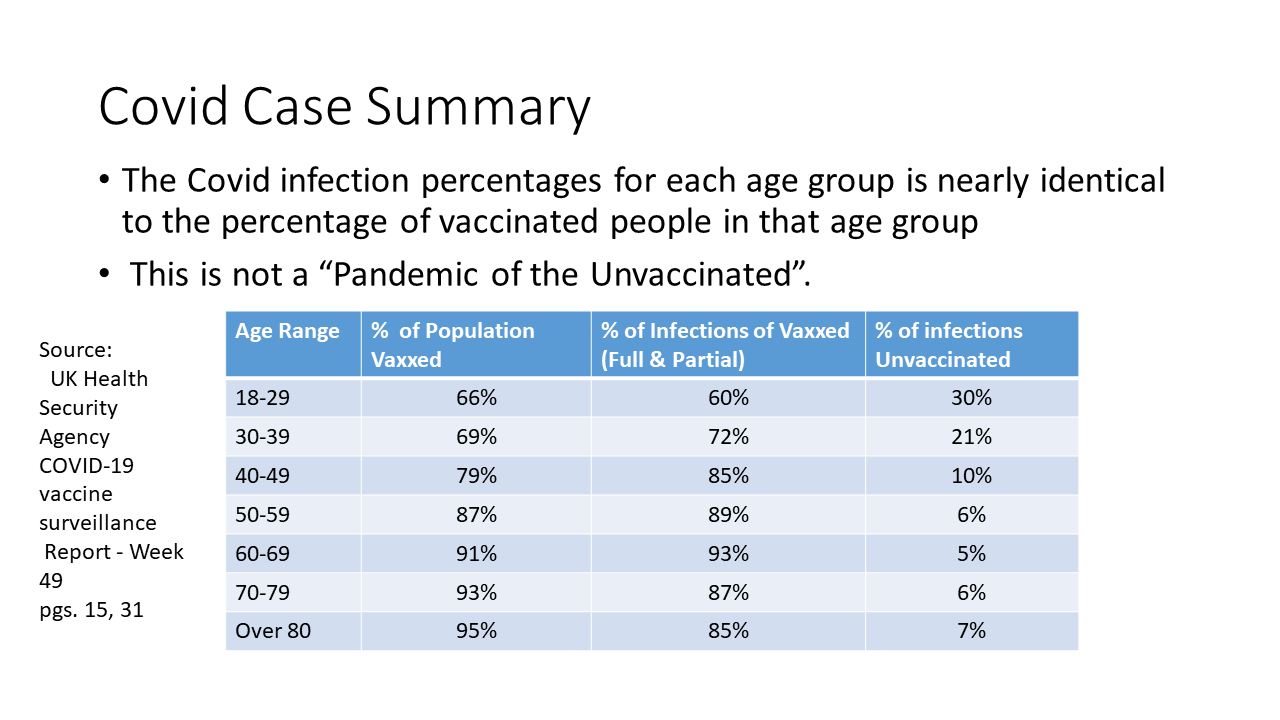
Source:UK HealthSecurity Agency CoVID-19 vaccine Surveillance Report - Week 49 Pgs.15,31
This shows that False Fact 1.) and False Fact 2.) (From above) are really FALSE.
This is NOT a pandemic of the Unvaccinated.
BREAKTHROUGH infections for the "fully vaccinated" are NOT RARE. (relative to all infections) In fact, they are much more common than infections of the unvaccinated in many age groups.
QUESTION: "If the percentage vaccinated so closely matches the percent infected, does the vaccine REALLY prevent transmission?"
Covid Hospitalization and Death rates are nearly identical, Irrespective of Vaccination Status.
If the vaccines worked as promised, "breakthrough infections" would not result in a similar percentage of Hospitalization and Death.
The chart below shows that vaccinated people are as likely to be hospitalized or die from Covid in this age group as "unvaccinated" when they get Covid.
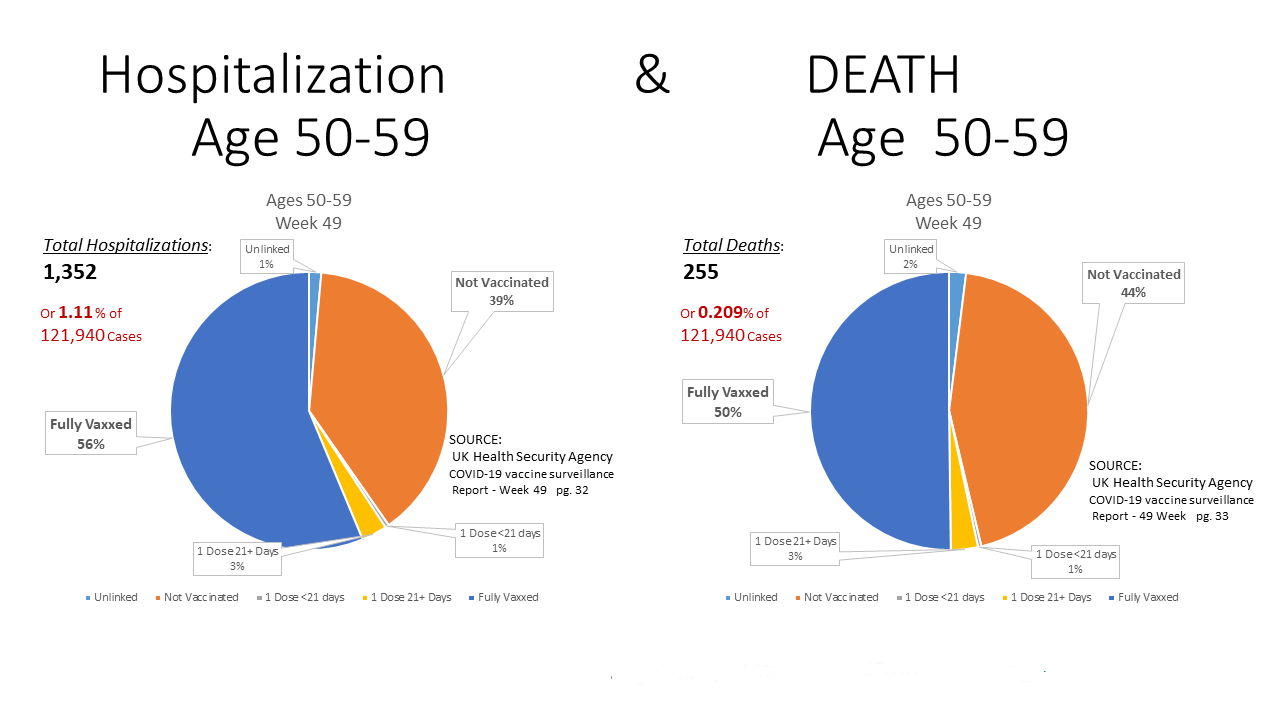
Source:UK HealthSecurity Agency CoVID-19 vaccine Surveillance Report - Week 49 Pgs.32,33
This shows that False Fact 3.) and False Fact 4.) (From above) are really FALSE.
Hospitalization and Death may impact all who get COVID, even so called "breakthrough infections".
BREAKTHROUGH infections for the "fully vaccinated" are NOT RARE. (relative to all infections) They can lead to a significant number of Deaths and Hospitalizations.
QUESTION: "Why isn't the vaccine preventing more hospitalizations and deaths for the 'Fully Vaccinated'?"
Real Infection data by Vaccination Status from the U.K.
The charts are broken out by Age Group. Ages 18-29 and 30-39 are shown below.
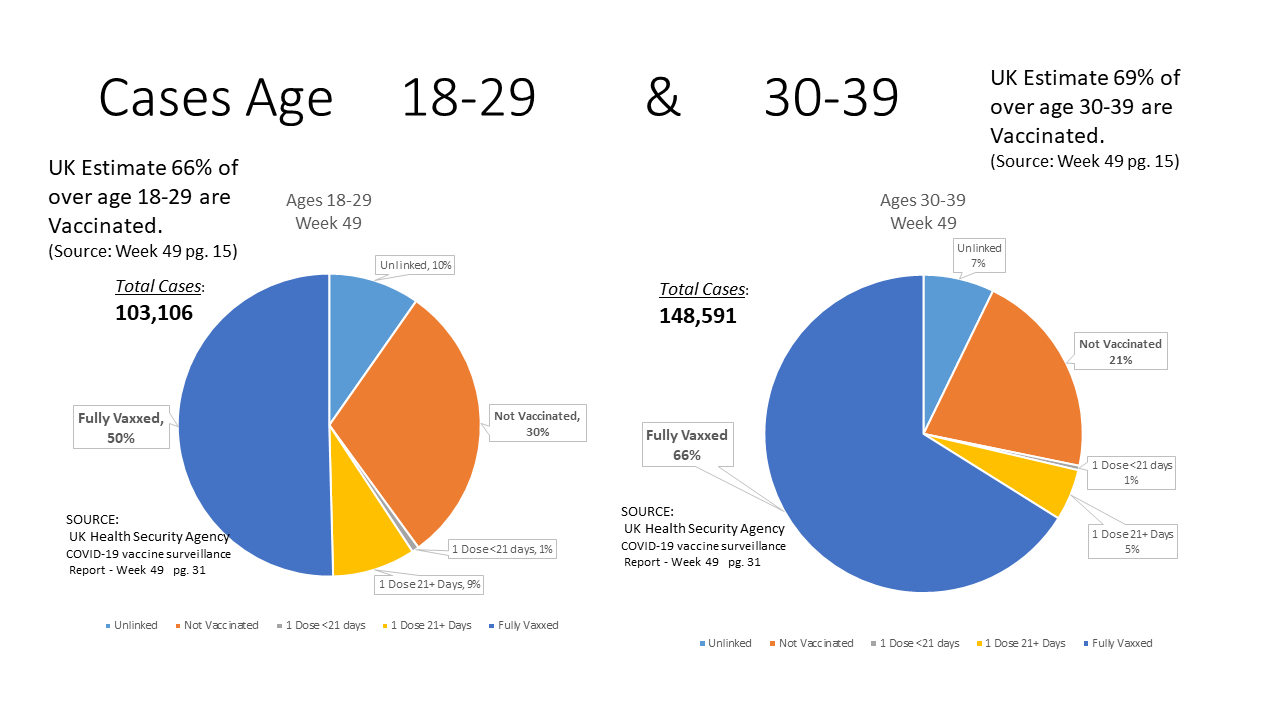
Fully Vaccinated is in BLUE. Single Dose Vaccination is in Yellow and Gray. "Unvaccinated" is in ORANGE.
The charts are broken out by Age Group. Ages 40-49 and 50-59 are shown below.
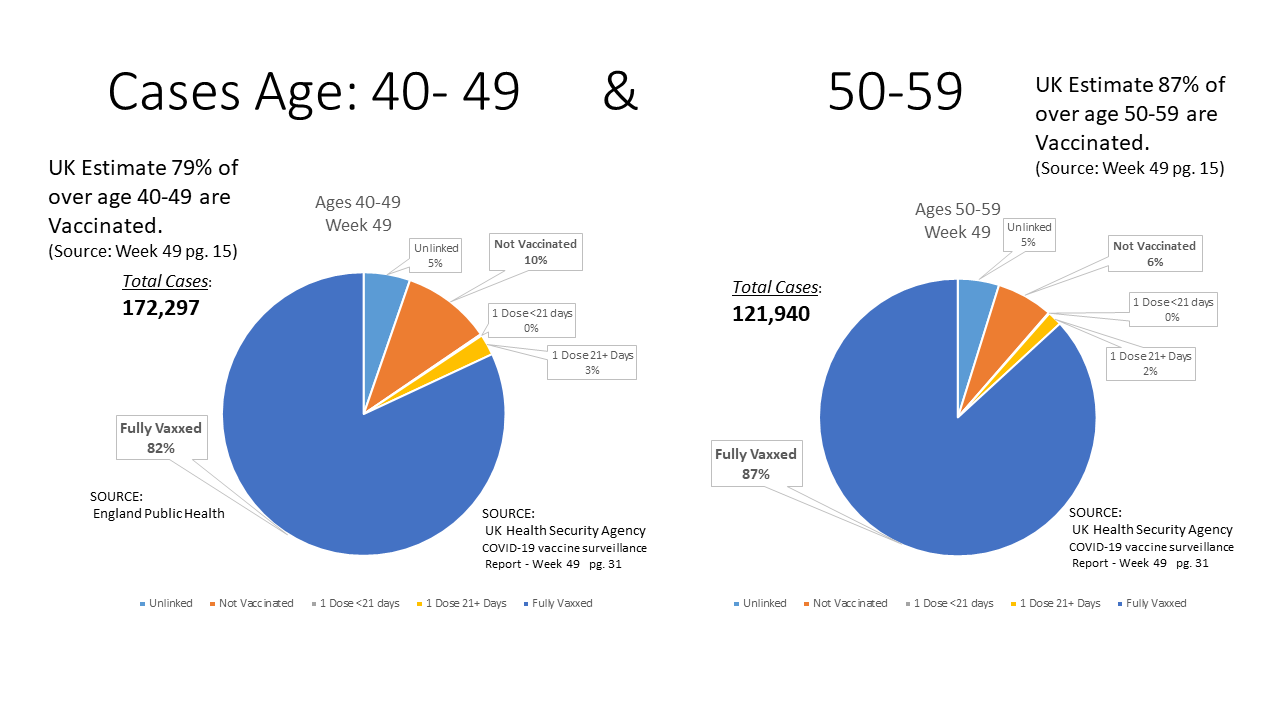
Fully Vaccinated is in BLUE. Single Dose Vaccination is in Yellow and Gray. "Unvaccinated" is in ORANGE.
The charts are broken out by Age Group. Ages 60-69 and 70-79 are shown below.
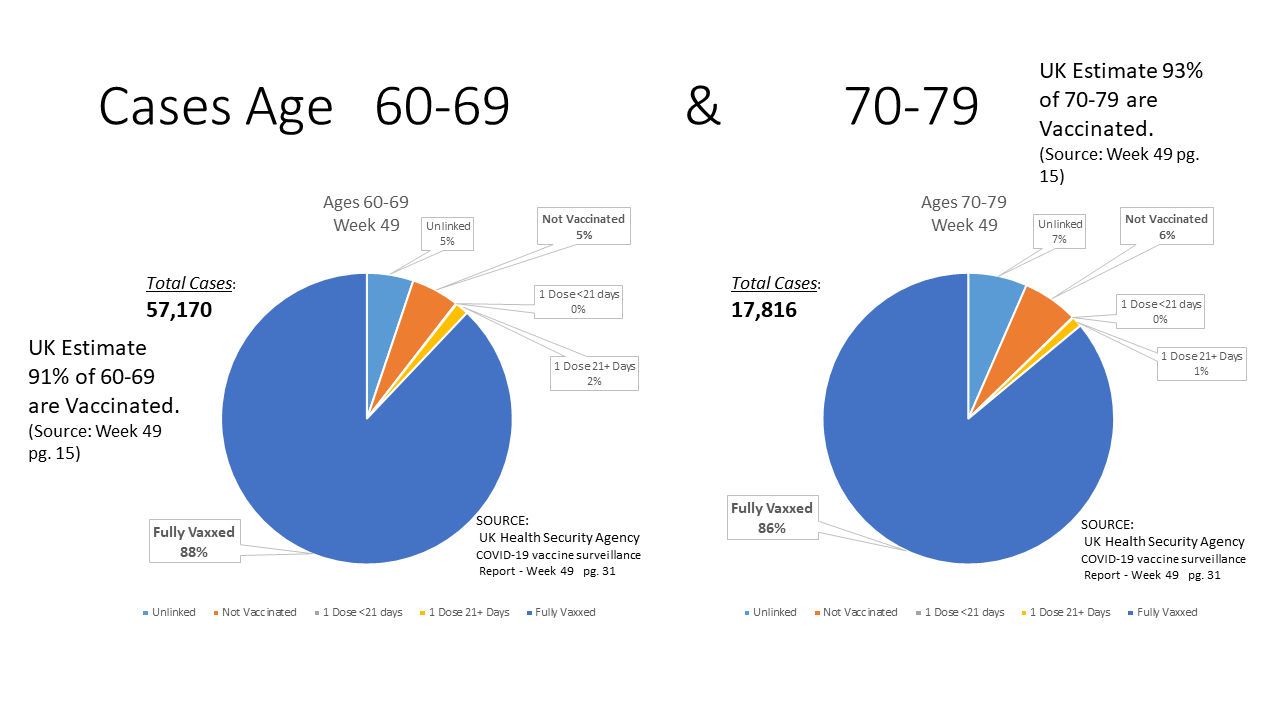
Fully Vaccinated is in BLUE. Single Dose Vaccination is in Yellow and Gray. "Unvaccinated" is in ORANGE.
The charts are broken out by Age Group. Ages 80 and above is shown below.

Fully Vaccinated is in BLUE. Single Dose Vaccination is in Yellow and Gray. "Unvaccinated" is in ORANGE
Source:UK HealthSecurity Agency CoVID-19 vaccine Surveillance Report - Week 49 Pg.31
Real Overnight Hospitalization data by Vaccination Status from the U.K.
The charts are broken out by Age Group. Ages 18-29 and 30-39 are shown below.
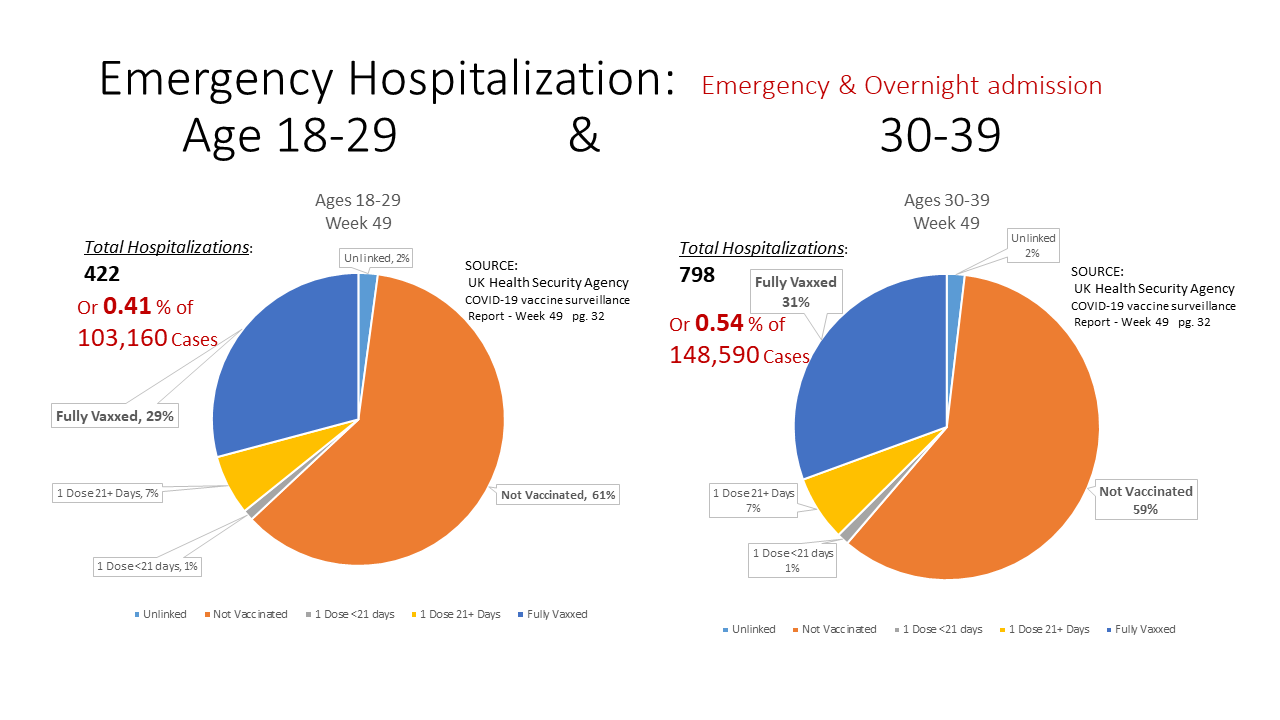
Fully Vaccinated is in BLUE. Single Dose Vaccination is in Yellow and Gray. "Unvaccinated" is in ORANGE.
The charts are broken out by Age Group. Ages 40-49 and 50-59 are shown below.

Fully Vaccinated is in BLUE. Single Dose Vaccination is in Yellow and Gray. "Unvaccinated" is in ORANGE.
The charts are broken out by Age Group. Ages 60-69 and 70-79 are shown below.
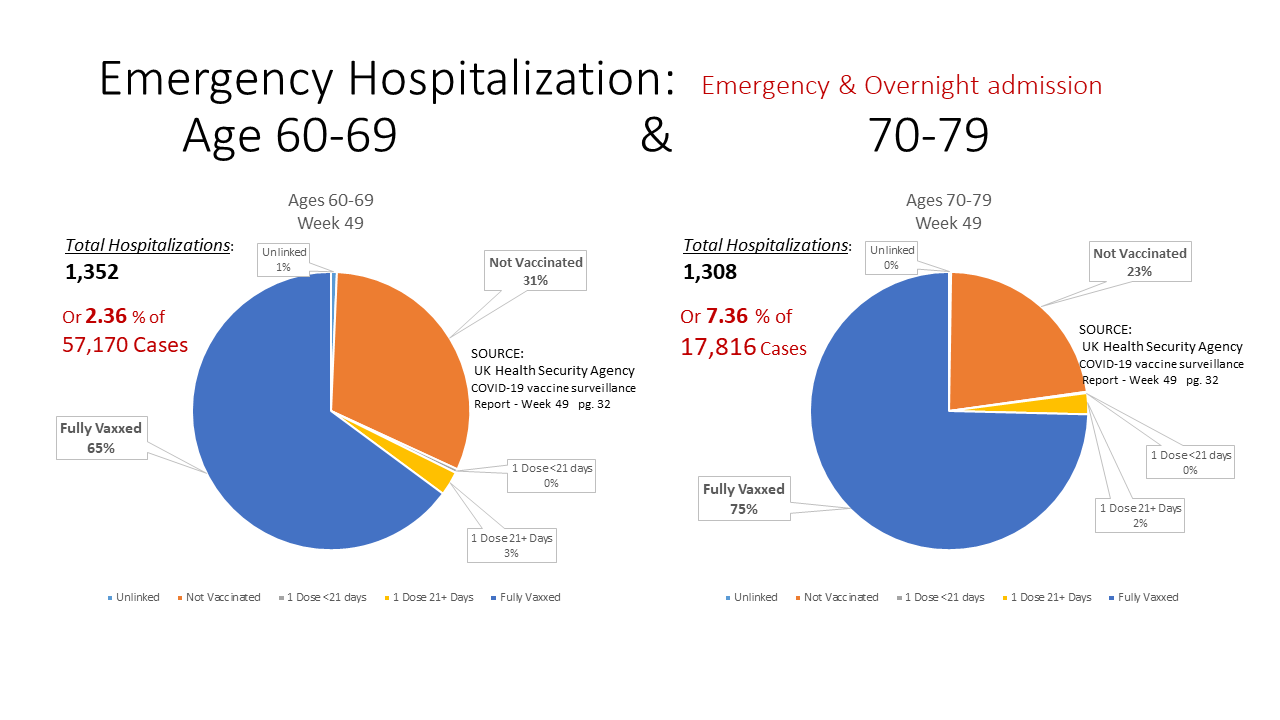
Fully Vaccinated is in BLUE. Single Dose Vaccination is in Yellow and Gray. "Unvaccinated" is in ORANGE.
The charts are broken out by Age Group. Ages 80 and above is shown below.
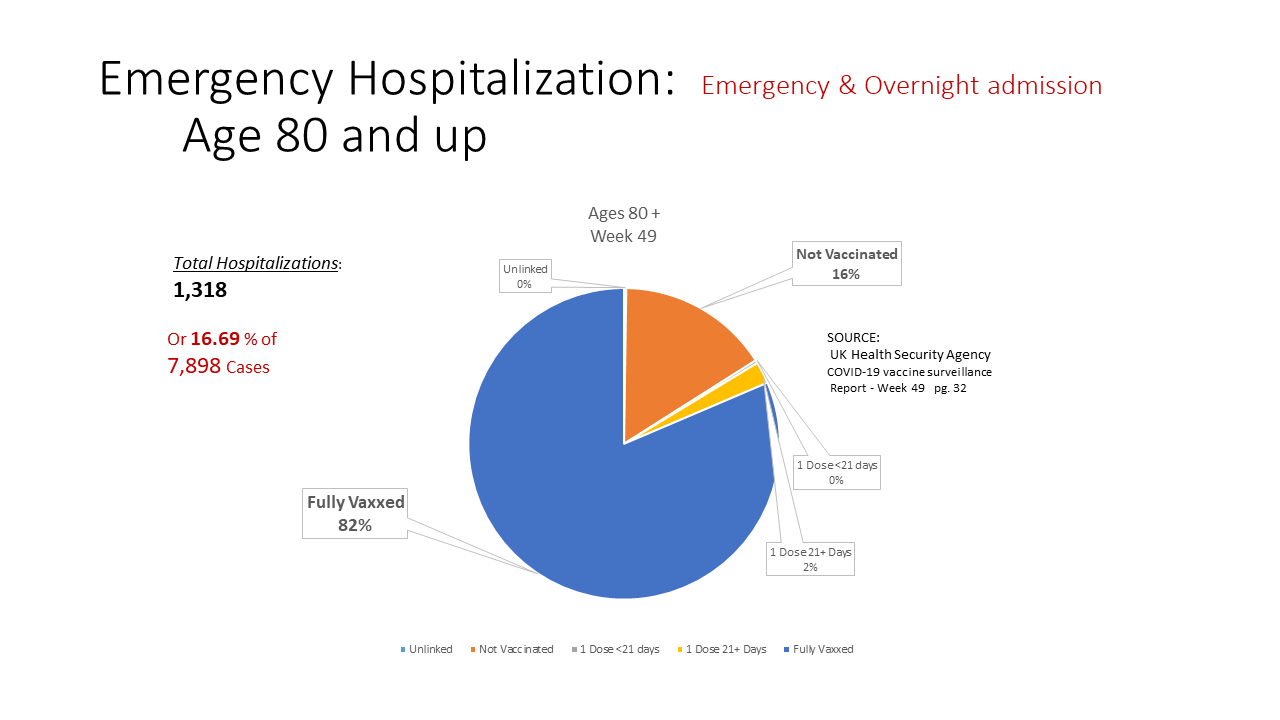
Fully Vaccinated is in BLUE. Single Dose Vaccination is in Yellow and Gray. "Unvaccinated" is in ORANGE.
Putting this in perspective: Hospitalizations are VERY small in number compared to Cases.
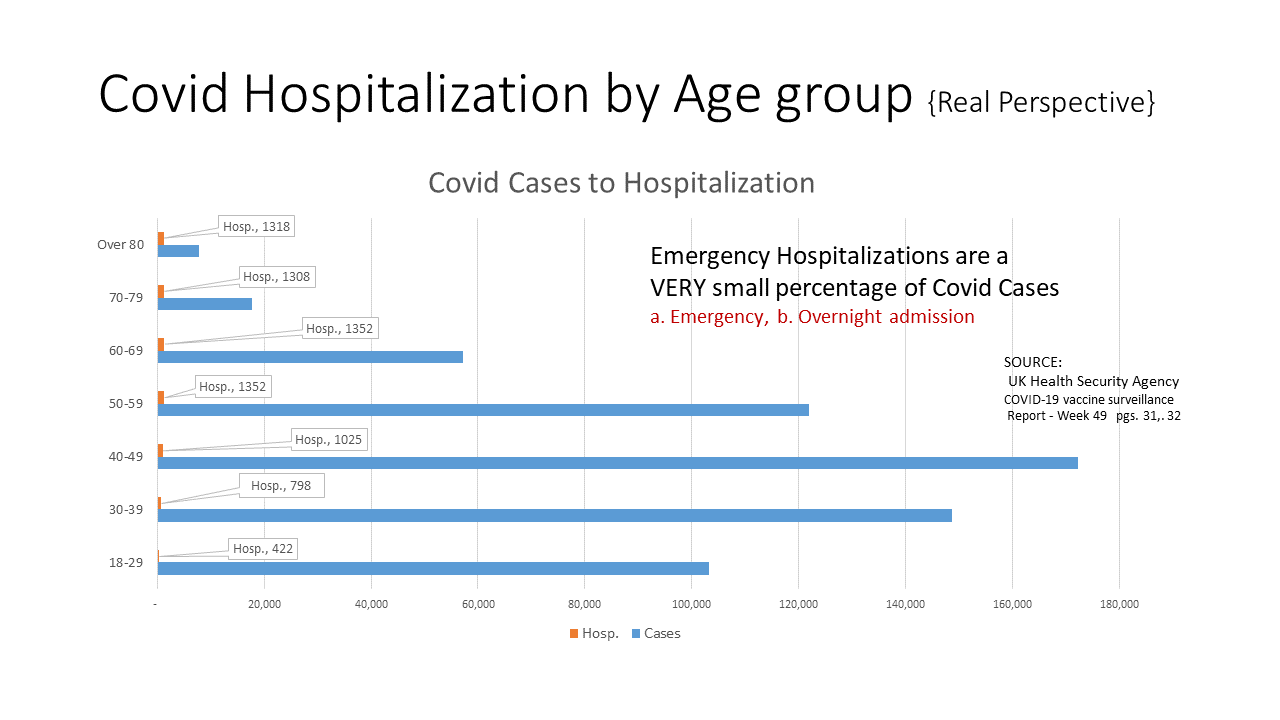
Cases by age group are in BLUE. "Hospitalization" is in ORANGE.
Source:UK HealthSecurity Agency CoVID-19 vaccine Surveillance Report - Week 49 Pg. 32
Real Covid DEATH data by Vaccination Status from the U.K.
The charts are broken out by Age Group. Ages 18-29 and 30-39 are shown below.
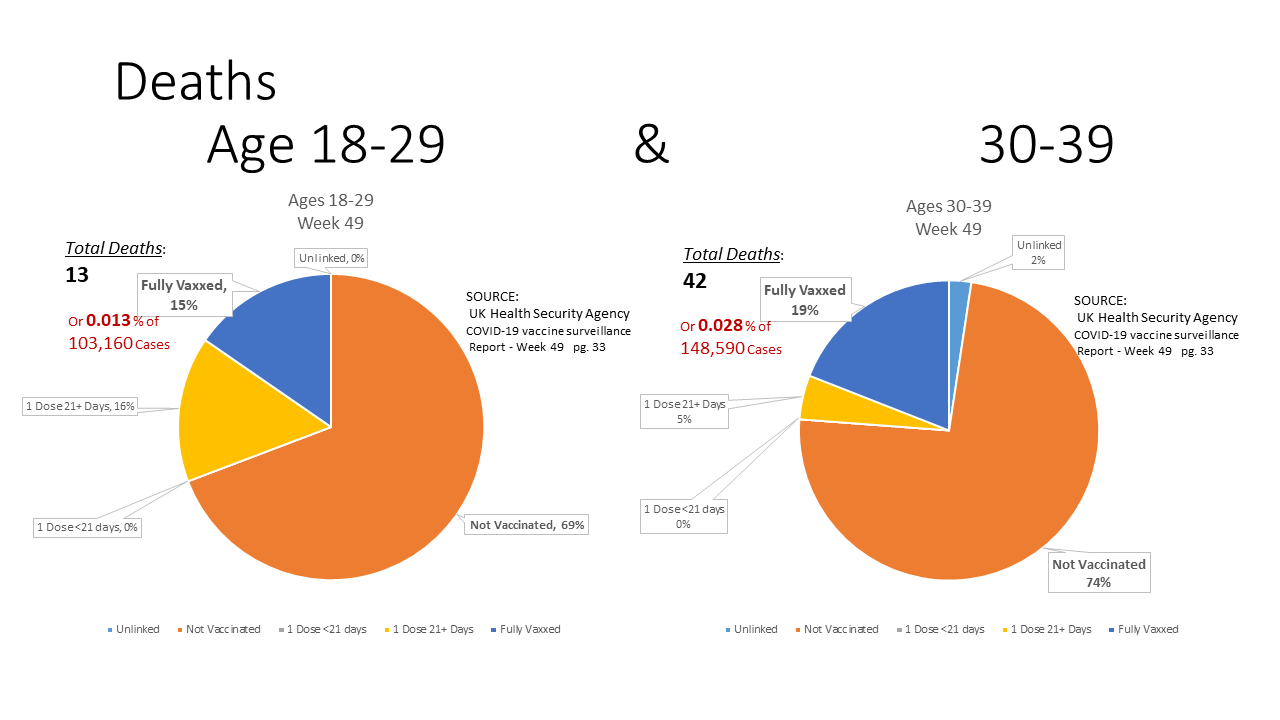
Fully Vaccinated is in BLUE. Single Dose Vaccination is in Yellow and Gray. "Unvaccinated" is in ORANGE.
Note: even though there are deaths, as a percentage of those infected, the percentage is very small.
The charts are broken out by Age Group. Ages 40-49 and 50-59 are shown below.
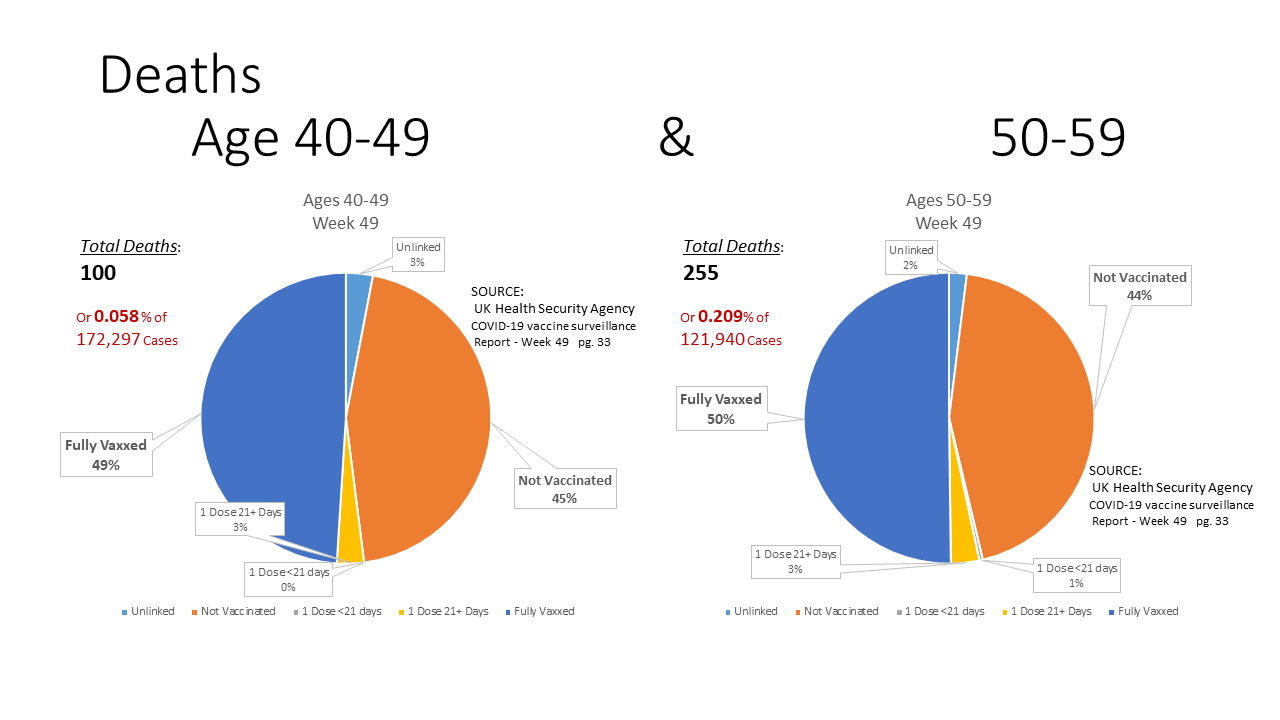
Fully Vaccinated is in BLUE. Single Dose Vaccination is in Yellow and Gray. "Unvaccinated" is in ORANGE
Note: even though there are deaths, as a percentage of those infected, the percentage is very small.
The charts are broken out by Age Group. Ages 60-69 and 70-79 are shown below.
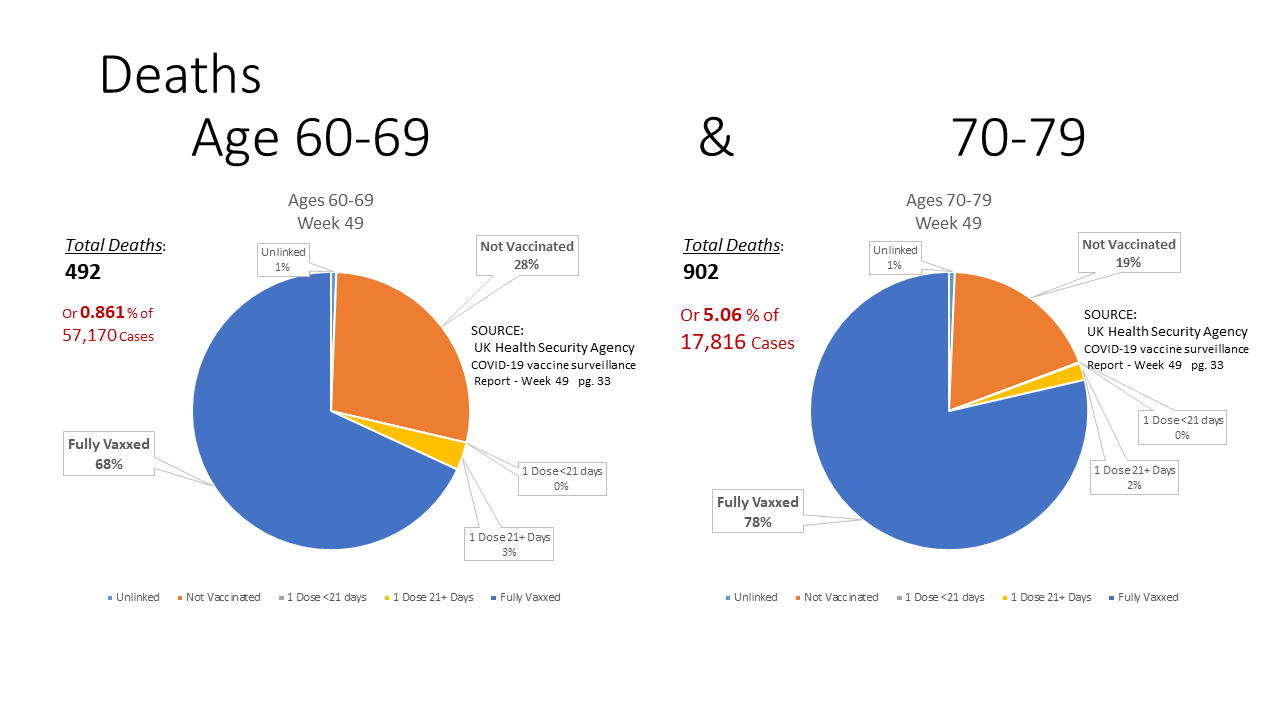
Fully Vaccinated is in BLUE. Single Dose Vaccination is in Yellow and Gray. "Unvaccinated" is in ORANGE.
Note: even though there are deaths, as a percentage of those infected, the percentage is relatively small.
The charts are broken out by Age Group. Ages 80 and above is shown below.
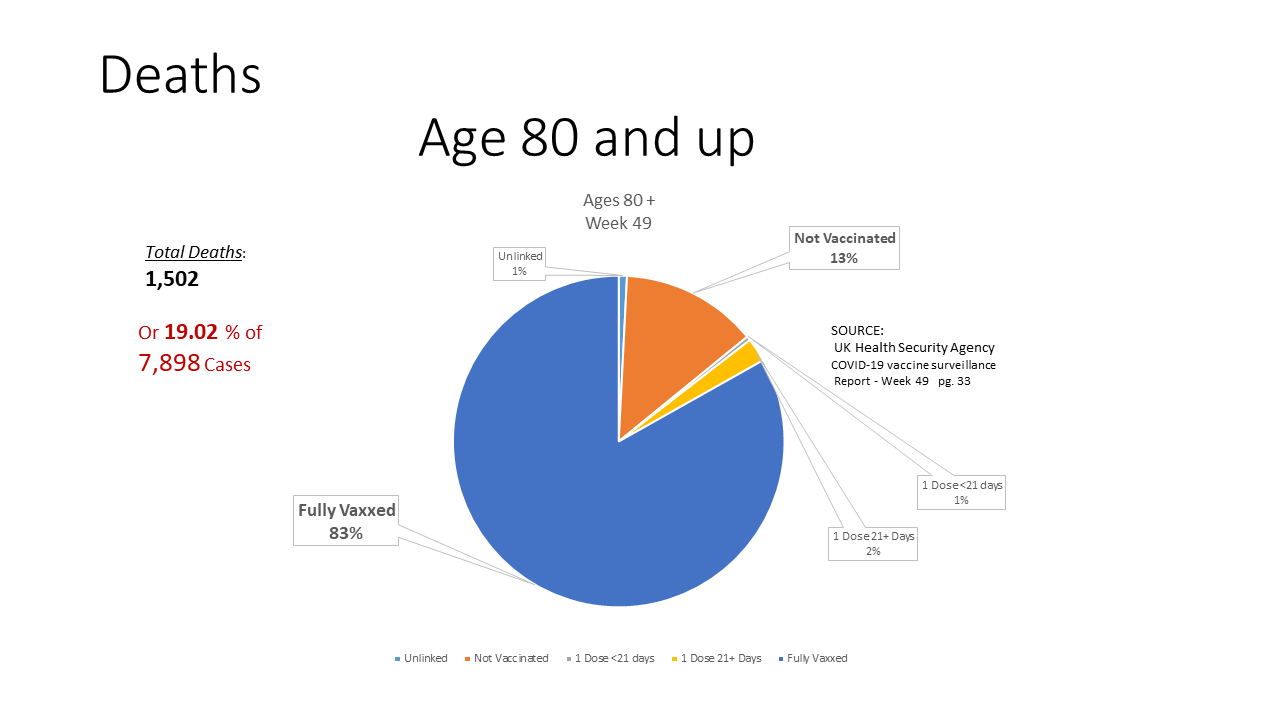
Fully Vaccinated is in BLUE. Single Dose Vaccination is in Yellow and Gray. "Unvaccinated" is in ORANGE.
Putting this in perspective: Hospitalizations are VERY tiny in number compared to Cases for many age groups.
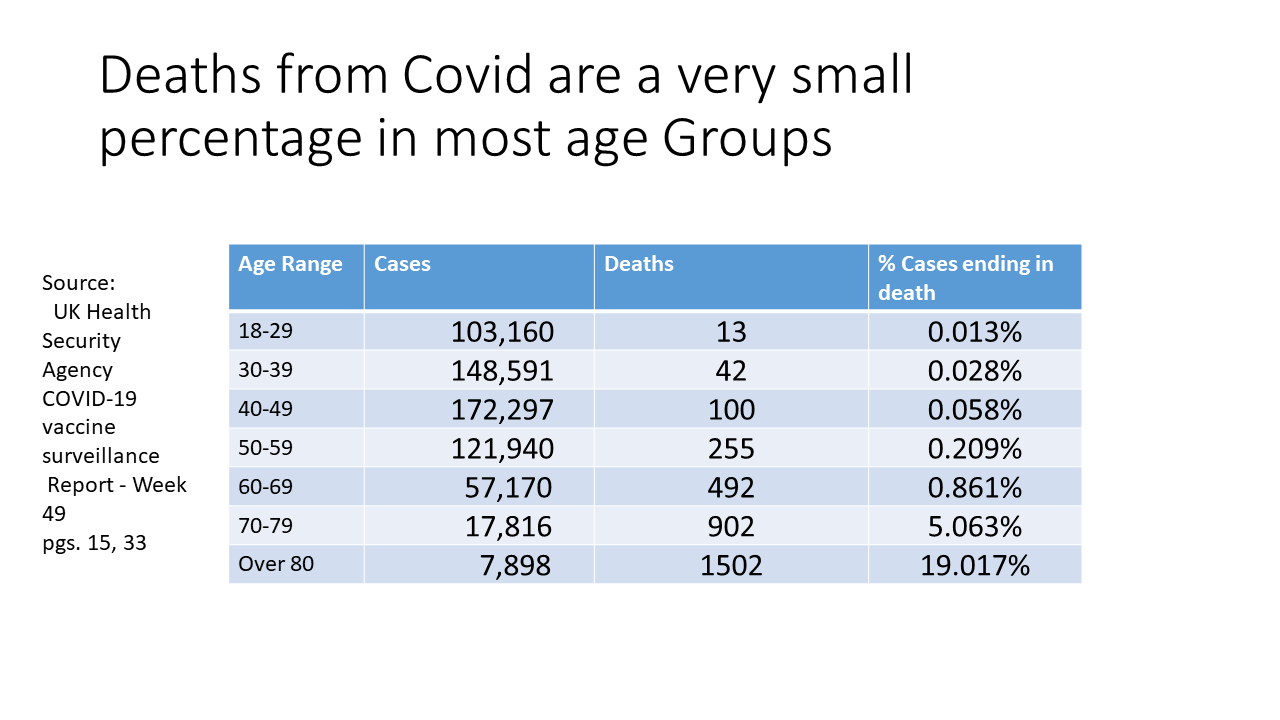
The percentage of cases that ACTUALLY result in death are very small for most age groups
Source:UK HealthSecurity Agency CoVID-19 vaccine Surveillance Report - Week 49 Pg.33
Where can this data be found?
This data can be found in : UK HealthSecurity Agency CoVID-19 vaccine Surveillance Report - Week 49
Every week the UK Publishes another report, based on data gathered from a rolling number of weeks. We used Week 49 Data,Published December 9, 2021. You can use any report and get similar results.
Here are the some of the weeks we also referenced, but we only used the week 49 Report.
 |
 |
 |
| 25 November 2021 |
2 December 2021 |
9 December 2021 |
 |
 |
| 16 December 2021 |
23 December 2021 |
What does a page of data look like?
This is the page for Cases
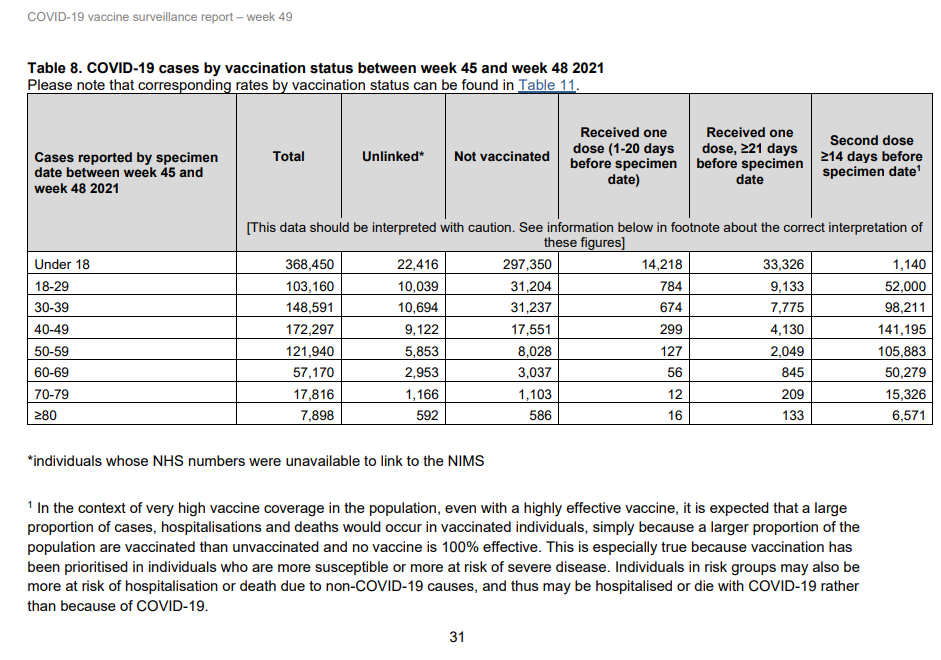
NOTE: Always read the disclaimer part at the bottom of the page. It tends to show the counts are "conservative".
This is the page for Hospitalizations
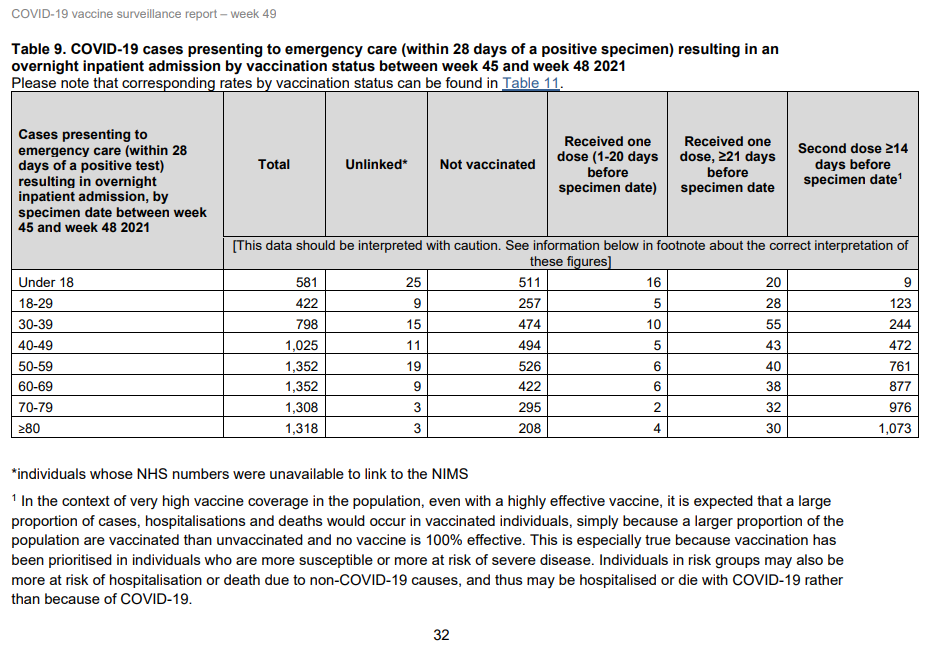
NOTE: This disclaimer says a lot that most people may not "know". For instance, if you are admitted to an emergency Hospital, as a result of an infection BUT DO NOT STAY OVERNIGHT, you will not be counted here.
Furthermore, the bottom disclaimer notes that, because more people are vaccinated, more "vaccinated" will be hospitalized and die from the virus. This is markedly different than the common understanding of a "vaccine". For instance, If this were true for Polio and Measles, we should be having MORE deaths from those diseases because so many people are vaccinated. We actually have very few dying of Polio and Measles. The disclaimers tell us a lot about the vaccine.
This is the page for Deaths
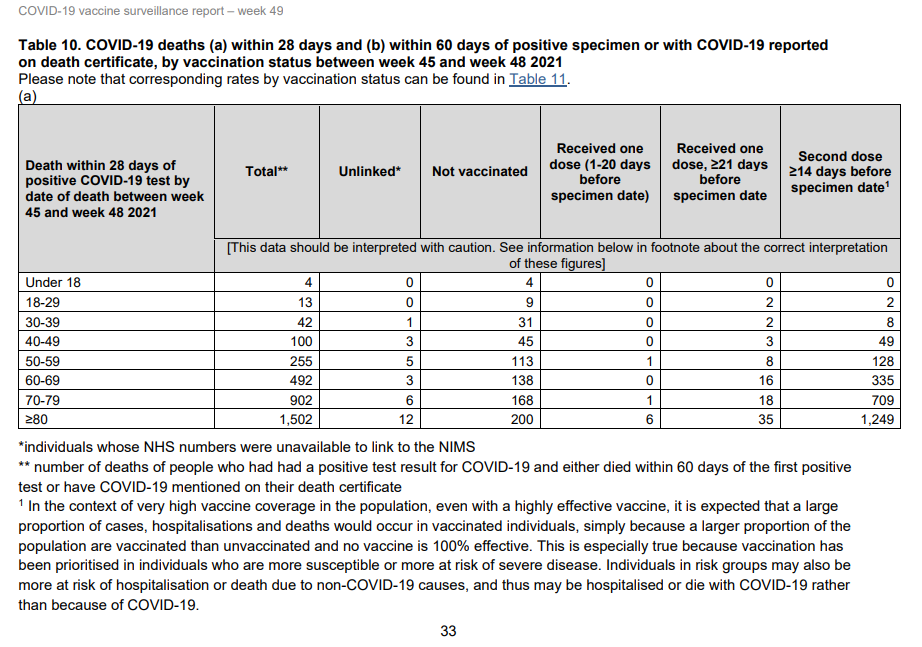
NOTE: Always read the disclaimer part at the bottom of the page. The disclaimer is similar to the previous one. But more importantly, note how very few deaths from the Covid for people under 50 relative to the number of cases.
Data from August and September are in line with current REAL FACTS
The Numbers, which are from Public Health England in the United Kingdom reveal amazing things. But they must be extracted from 2 or more reports.
Source:SARS-CoV-2 variants of concern and variants under investigation in England. Technical Briefing 20, 21, 22, 23.
You can check ALL these Numbers for yourself, with a little effort and a simple calculator.
The Facts are from numbers that must be calculated by reviewing two English sequential reports.
When you do "the Math", you will be rewarded with deep insights. We have precalculated these insights here to help you.
What was the Actual Probability of Contracting the Delta variant of CoVid in August through mid-September of 2021?
The Numbers are actually surprisingly low. They are MUCH lower than 1%.
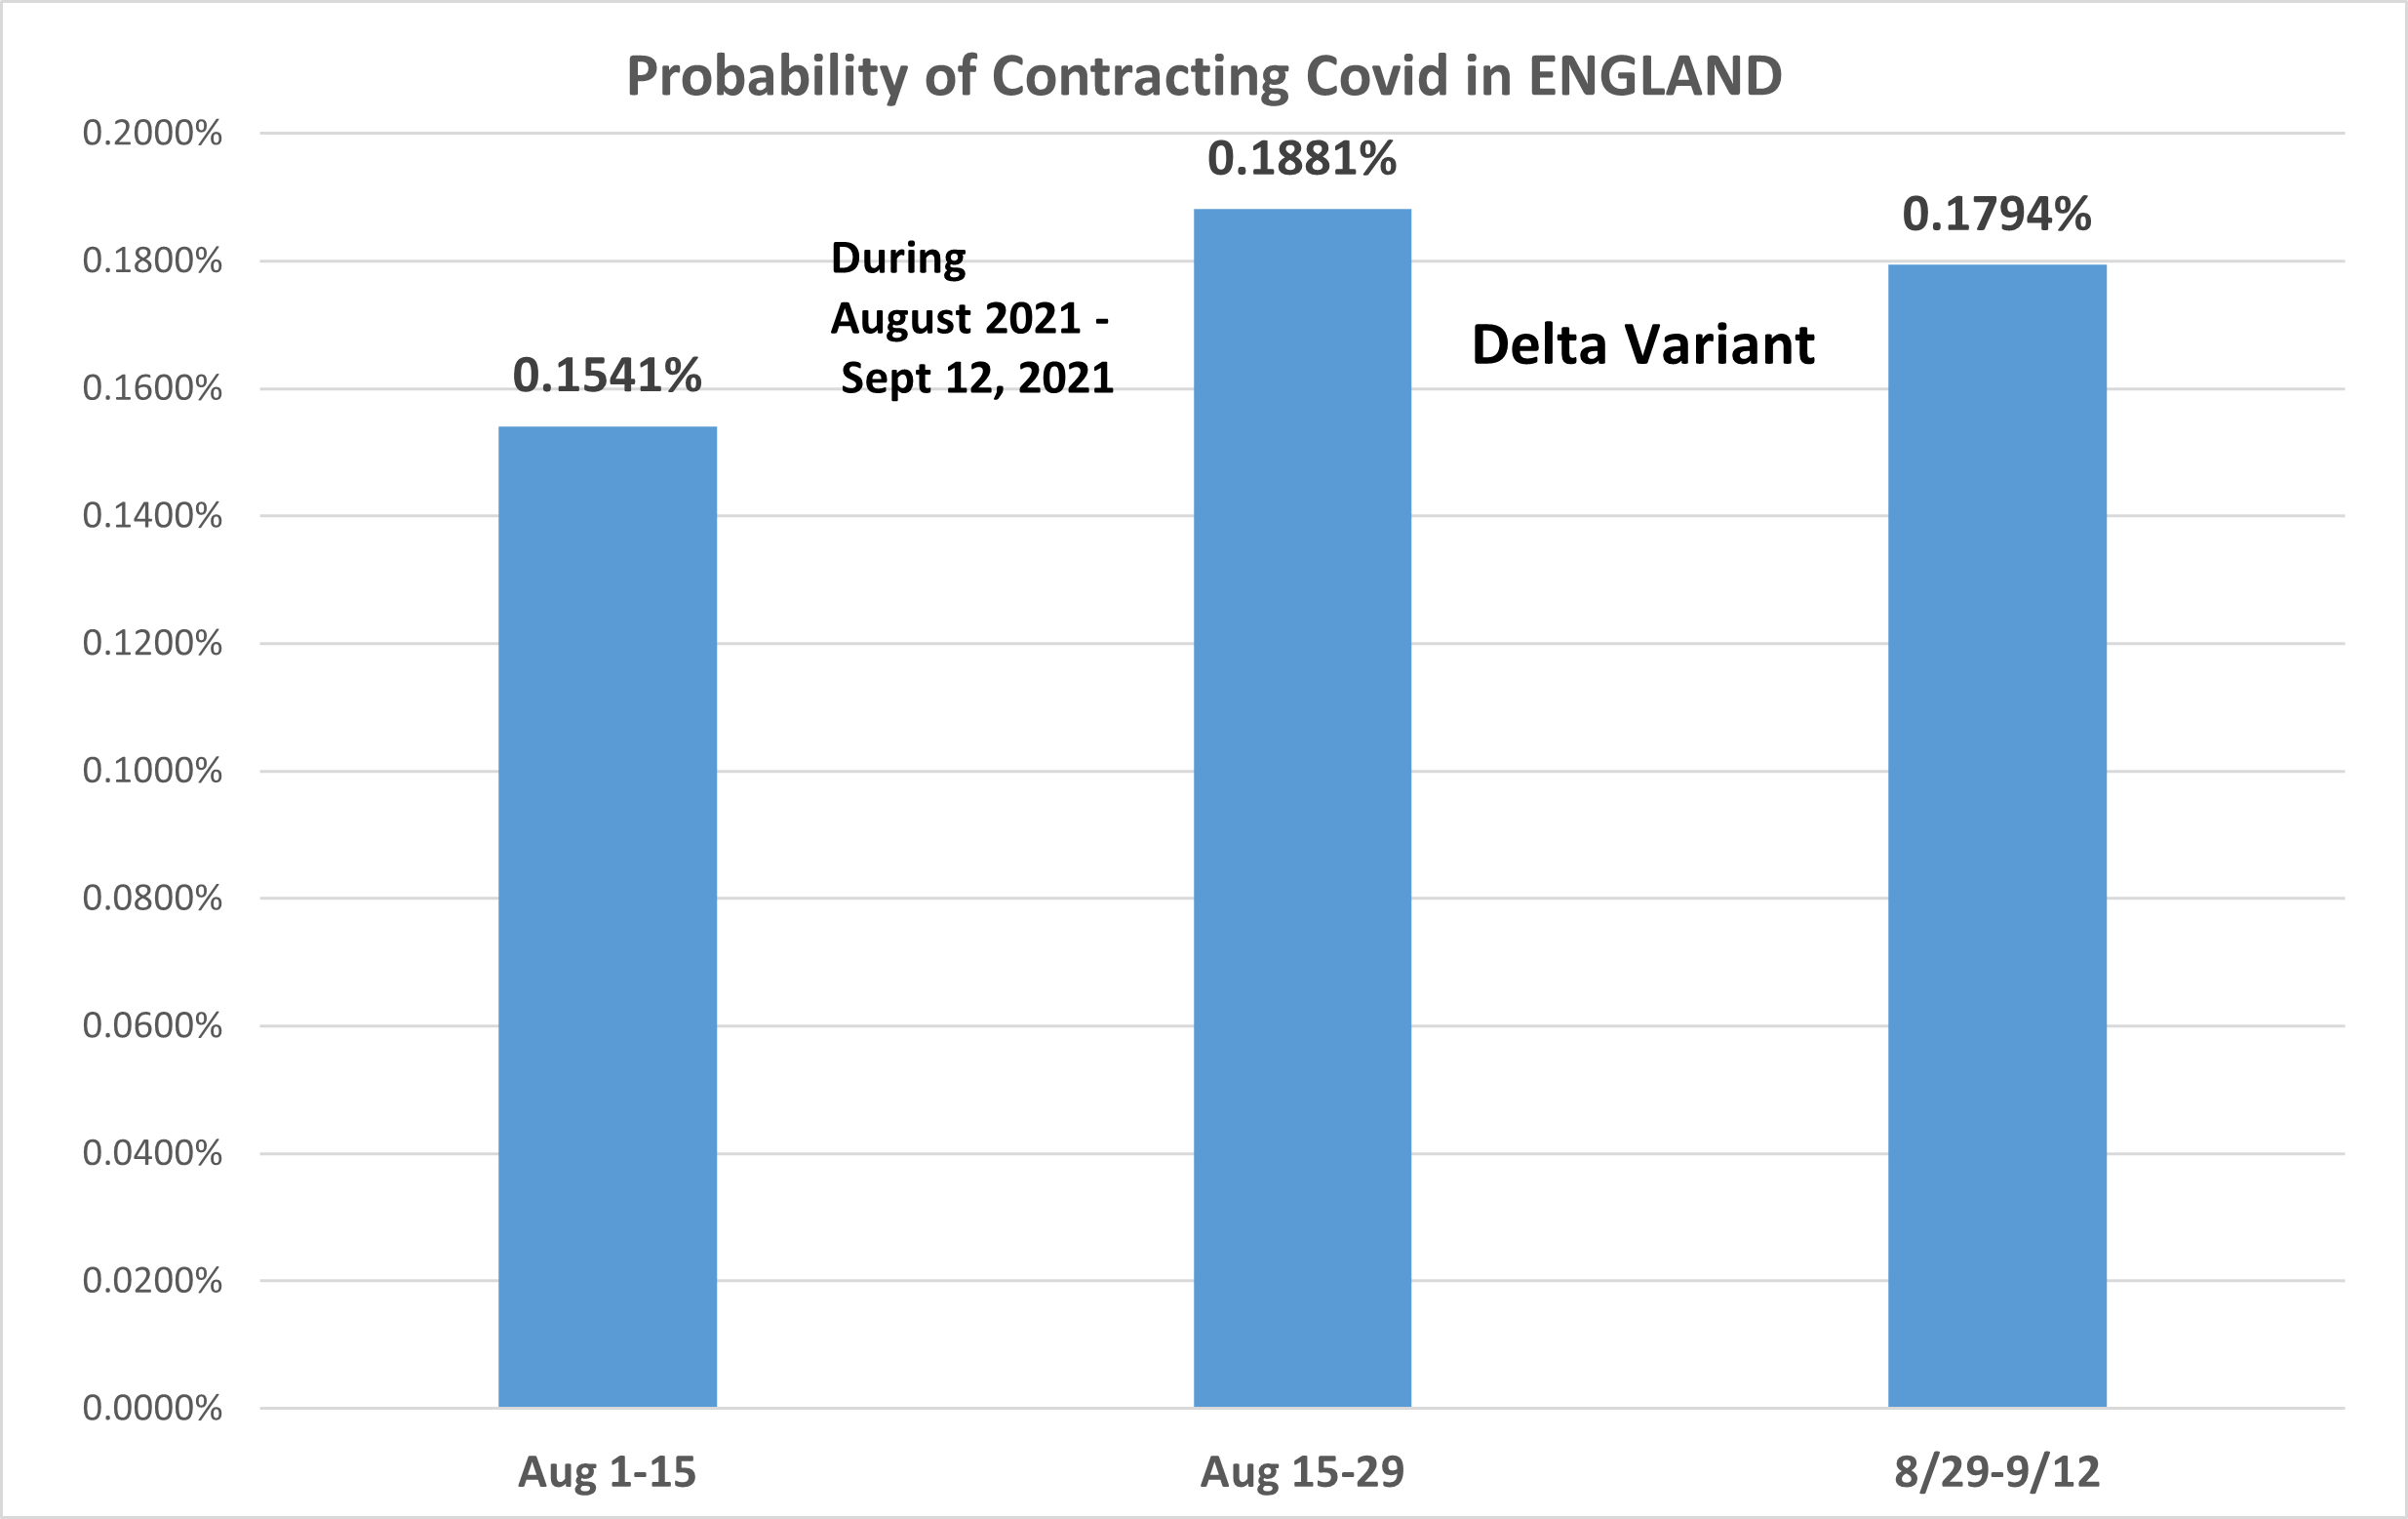
Source:SARS-CoV-2 variants of concern and variants under investigation in England. Technical Briefing 20, 21, 22, 23.
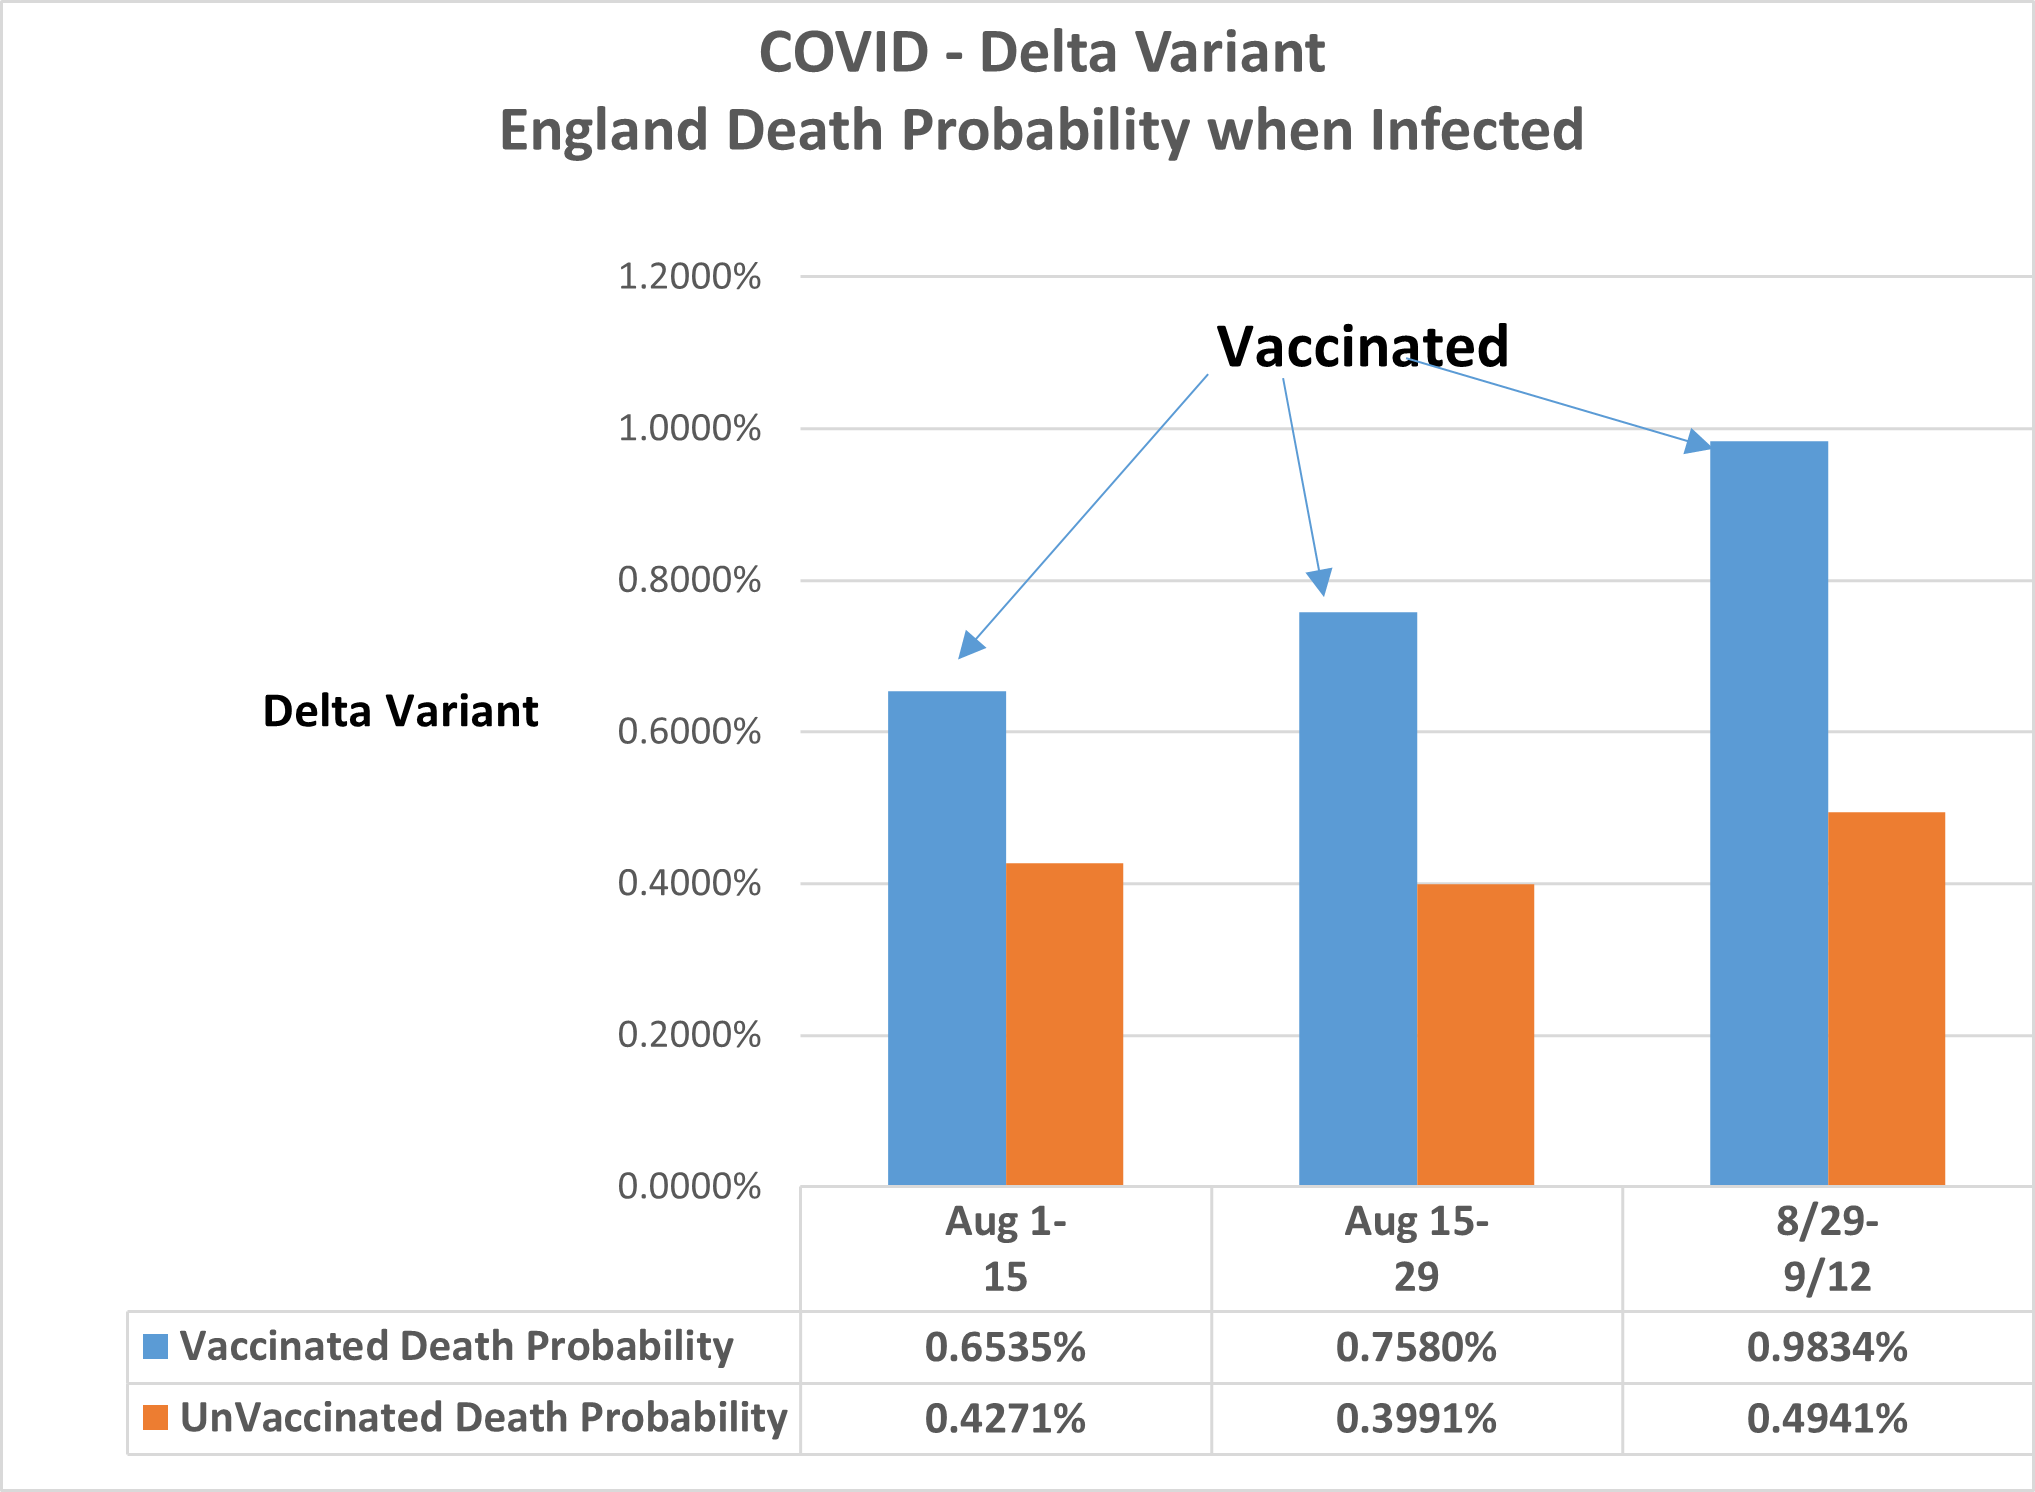
What was the Actual Probability of Dying from the Delta variant of CoVid from August through mid September of 2021?
The Numbers are actually SHOCKINGLY low. Both are SUBSTANTIALLY lower than 1%.
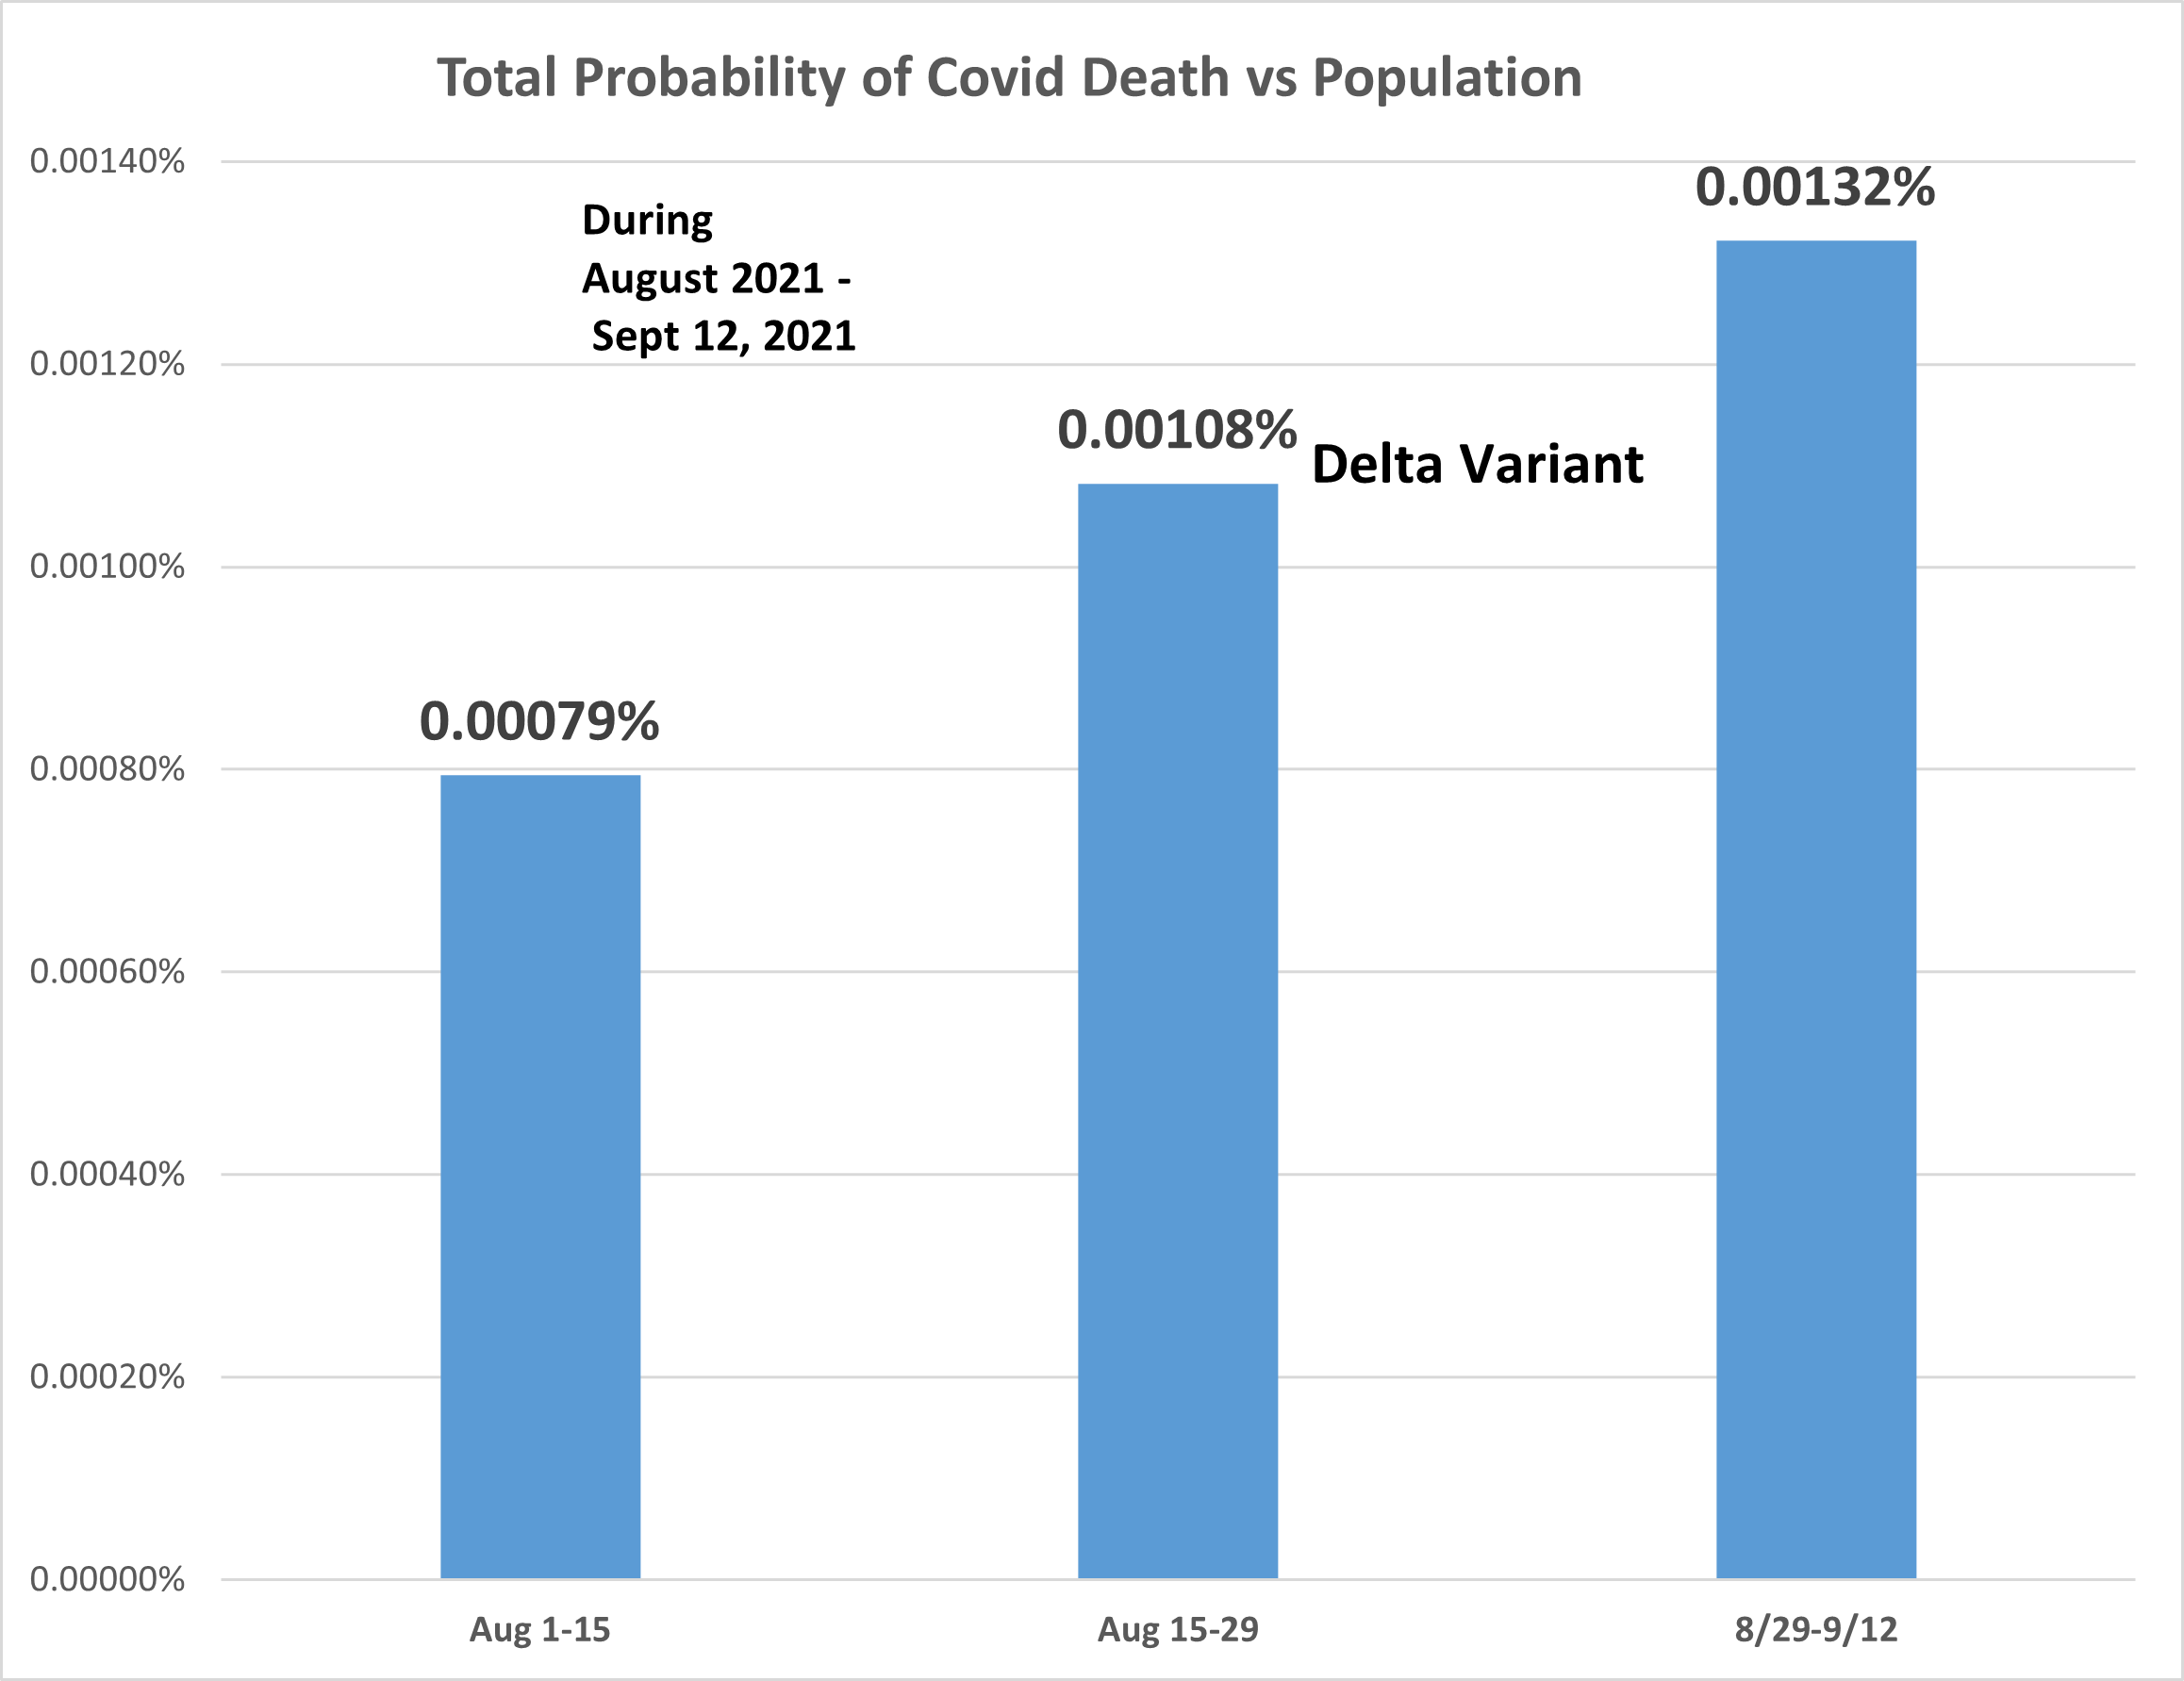
Source:SARS-CoV-2 variants of concern and variants under investigation in England. Technical Briefing 20, 21, 22, 23.
Yes, the numbers of DEATHS are low. But they appear even lower, when compared to other common causes of death in England.
Real Actuarial Table Probabilities compared to Dying from the Delta variant of CoVid in August 2021.
The numbers of Covid Delta variant deaths hardly show up at all in this graph.
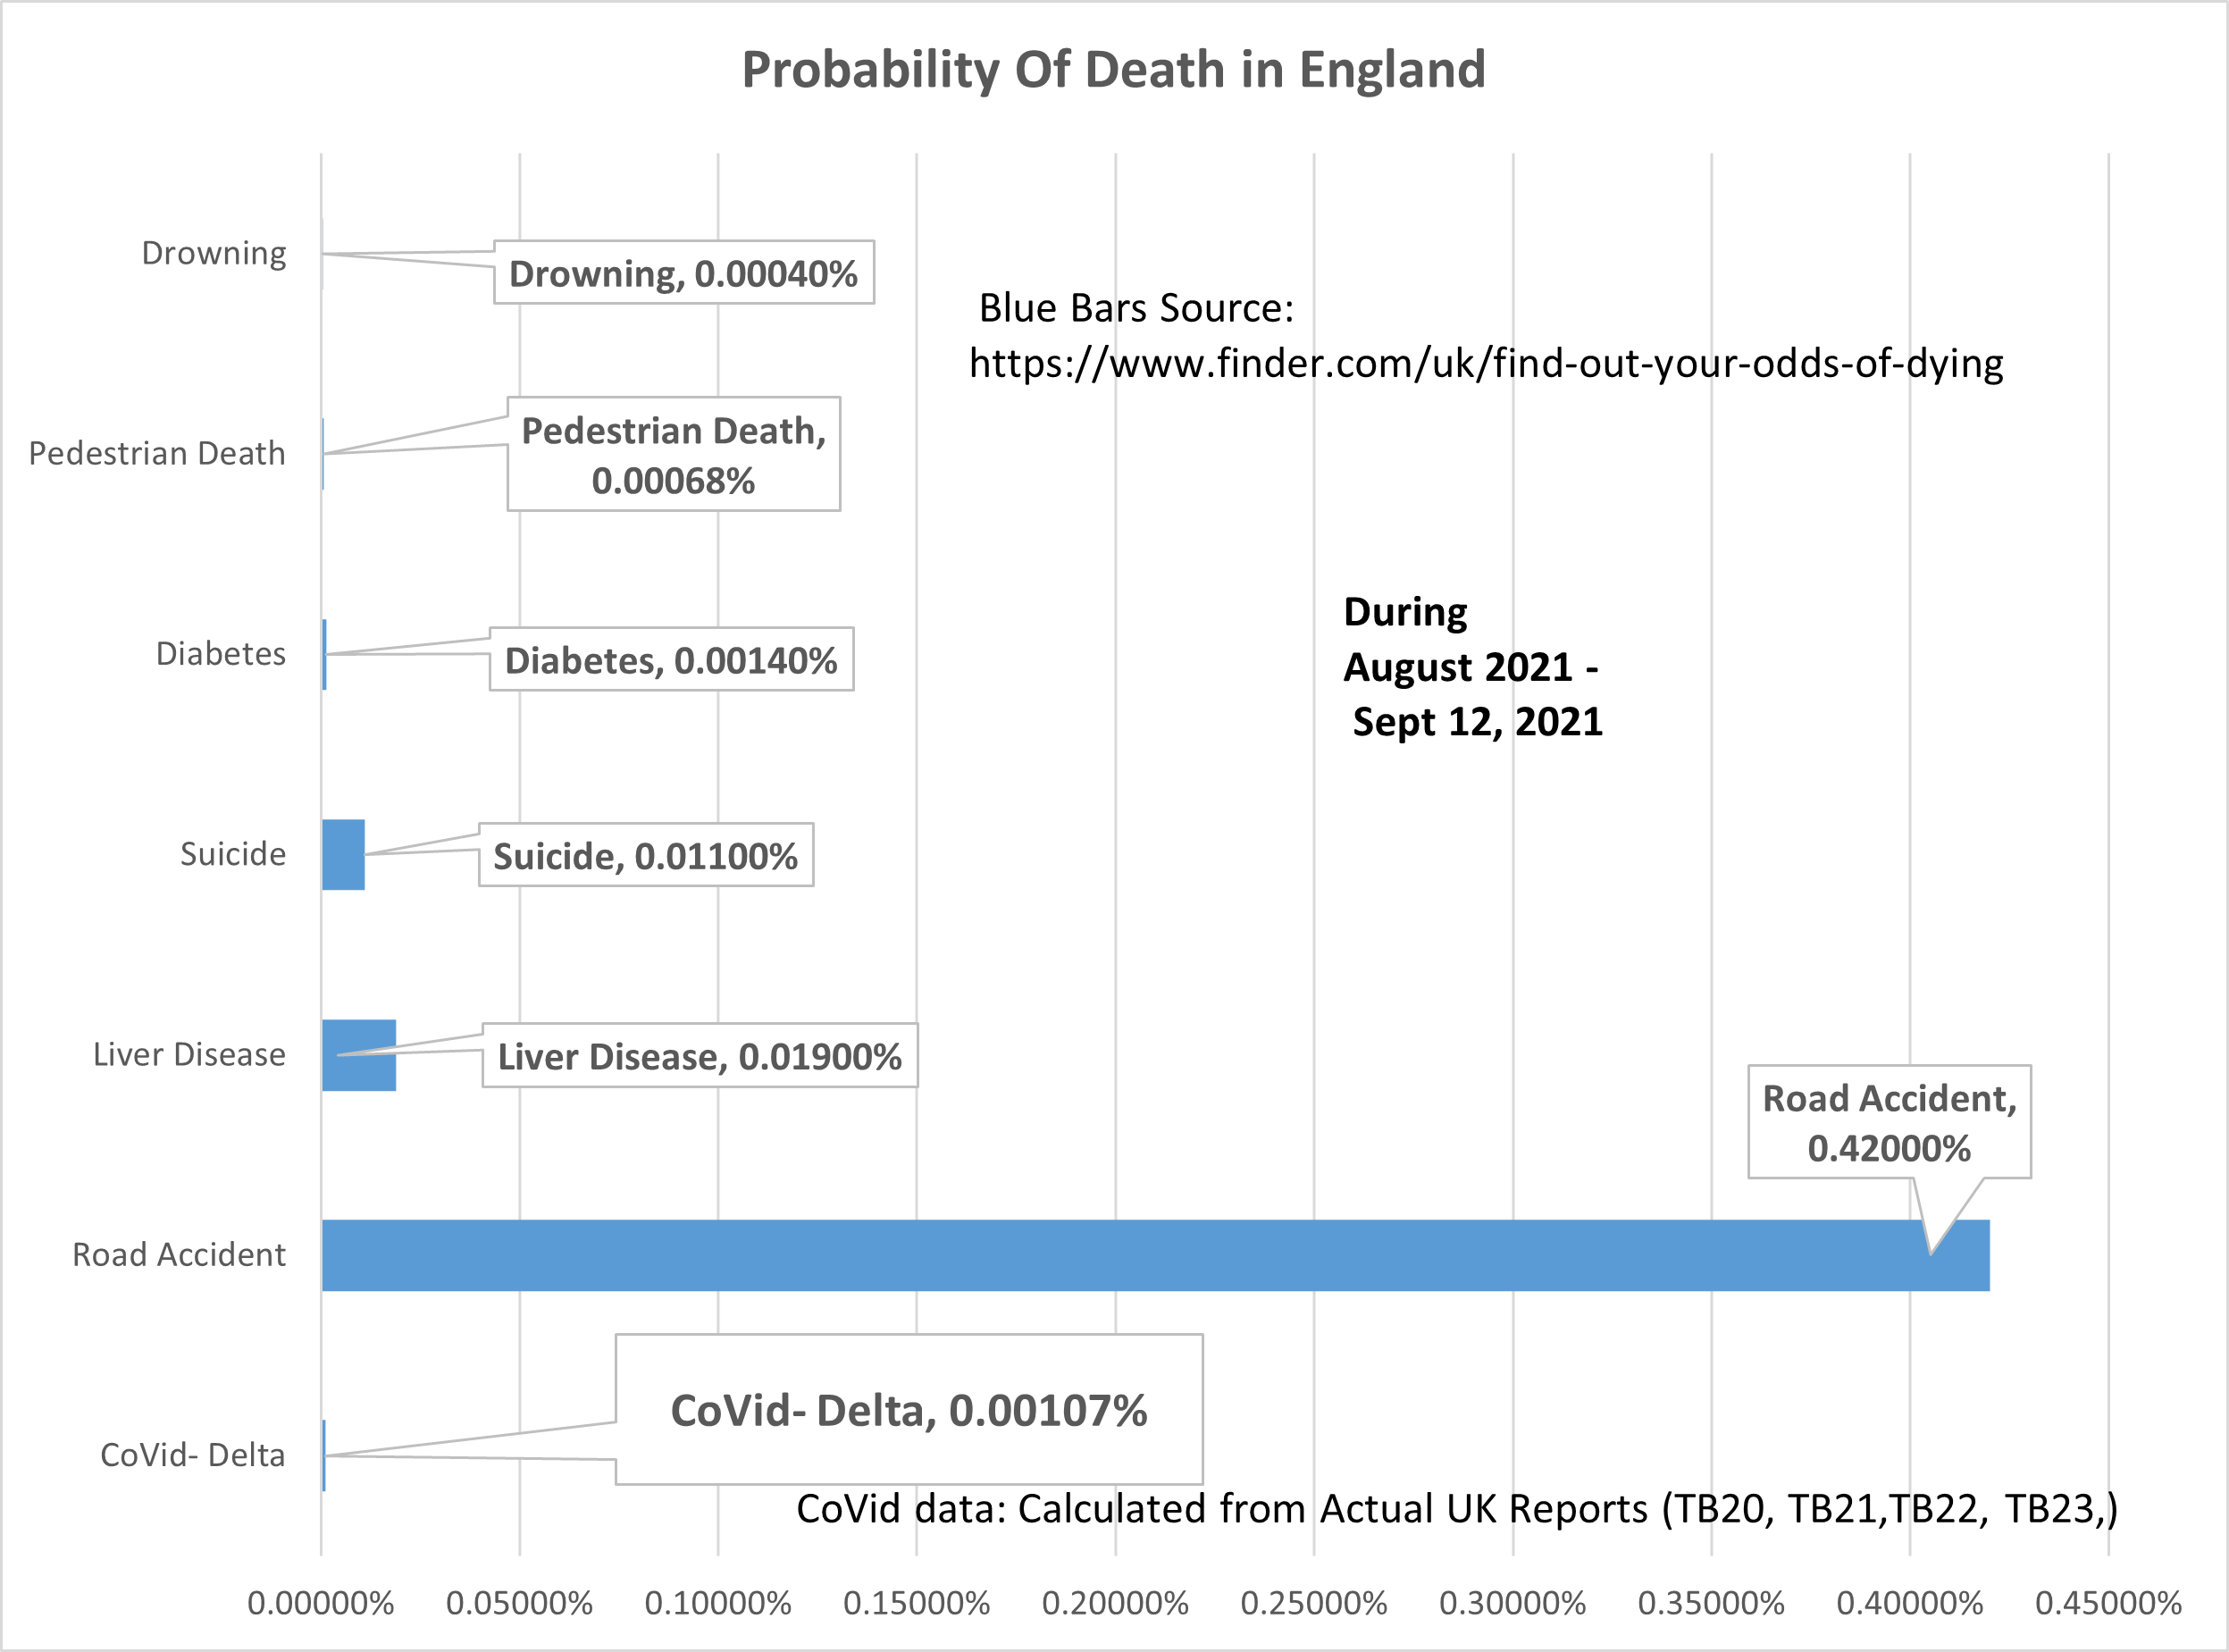
Source:SARS-CoV-2 variants of concern and variants under investigation in England. Technical Briefing 20, 21, 22, 23.
For some, even one death is thought to be too much. But, relative to other death causes, we gain perspective. From August 2021- 12 September 2021, death in England from CoVid-Delta variant was much lower than even a probability of being killed in a road accident.
Let's look in detail at Real Actuarial Table Probabilities compared to Dying from the Delta variant?
The chart below gives good comparisons to other death causes that are SUBSTANTIALLY lower than 1%.
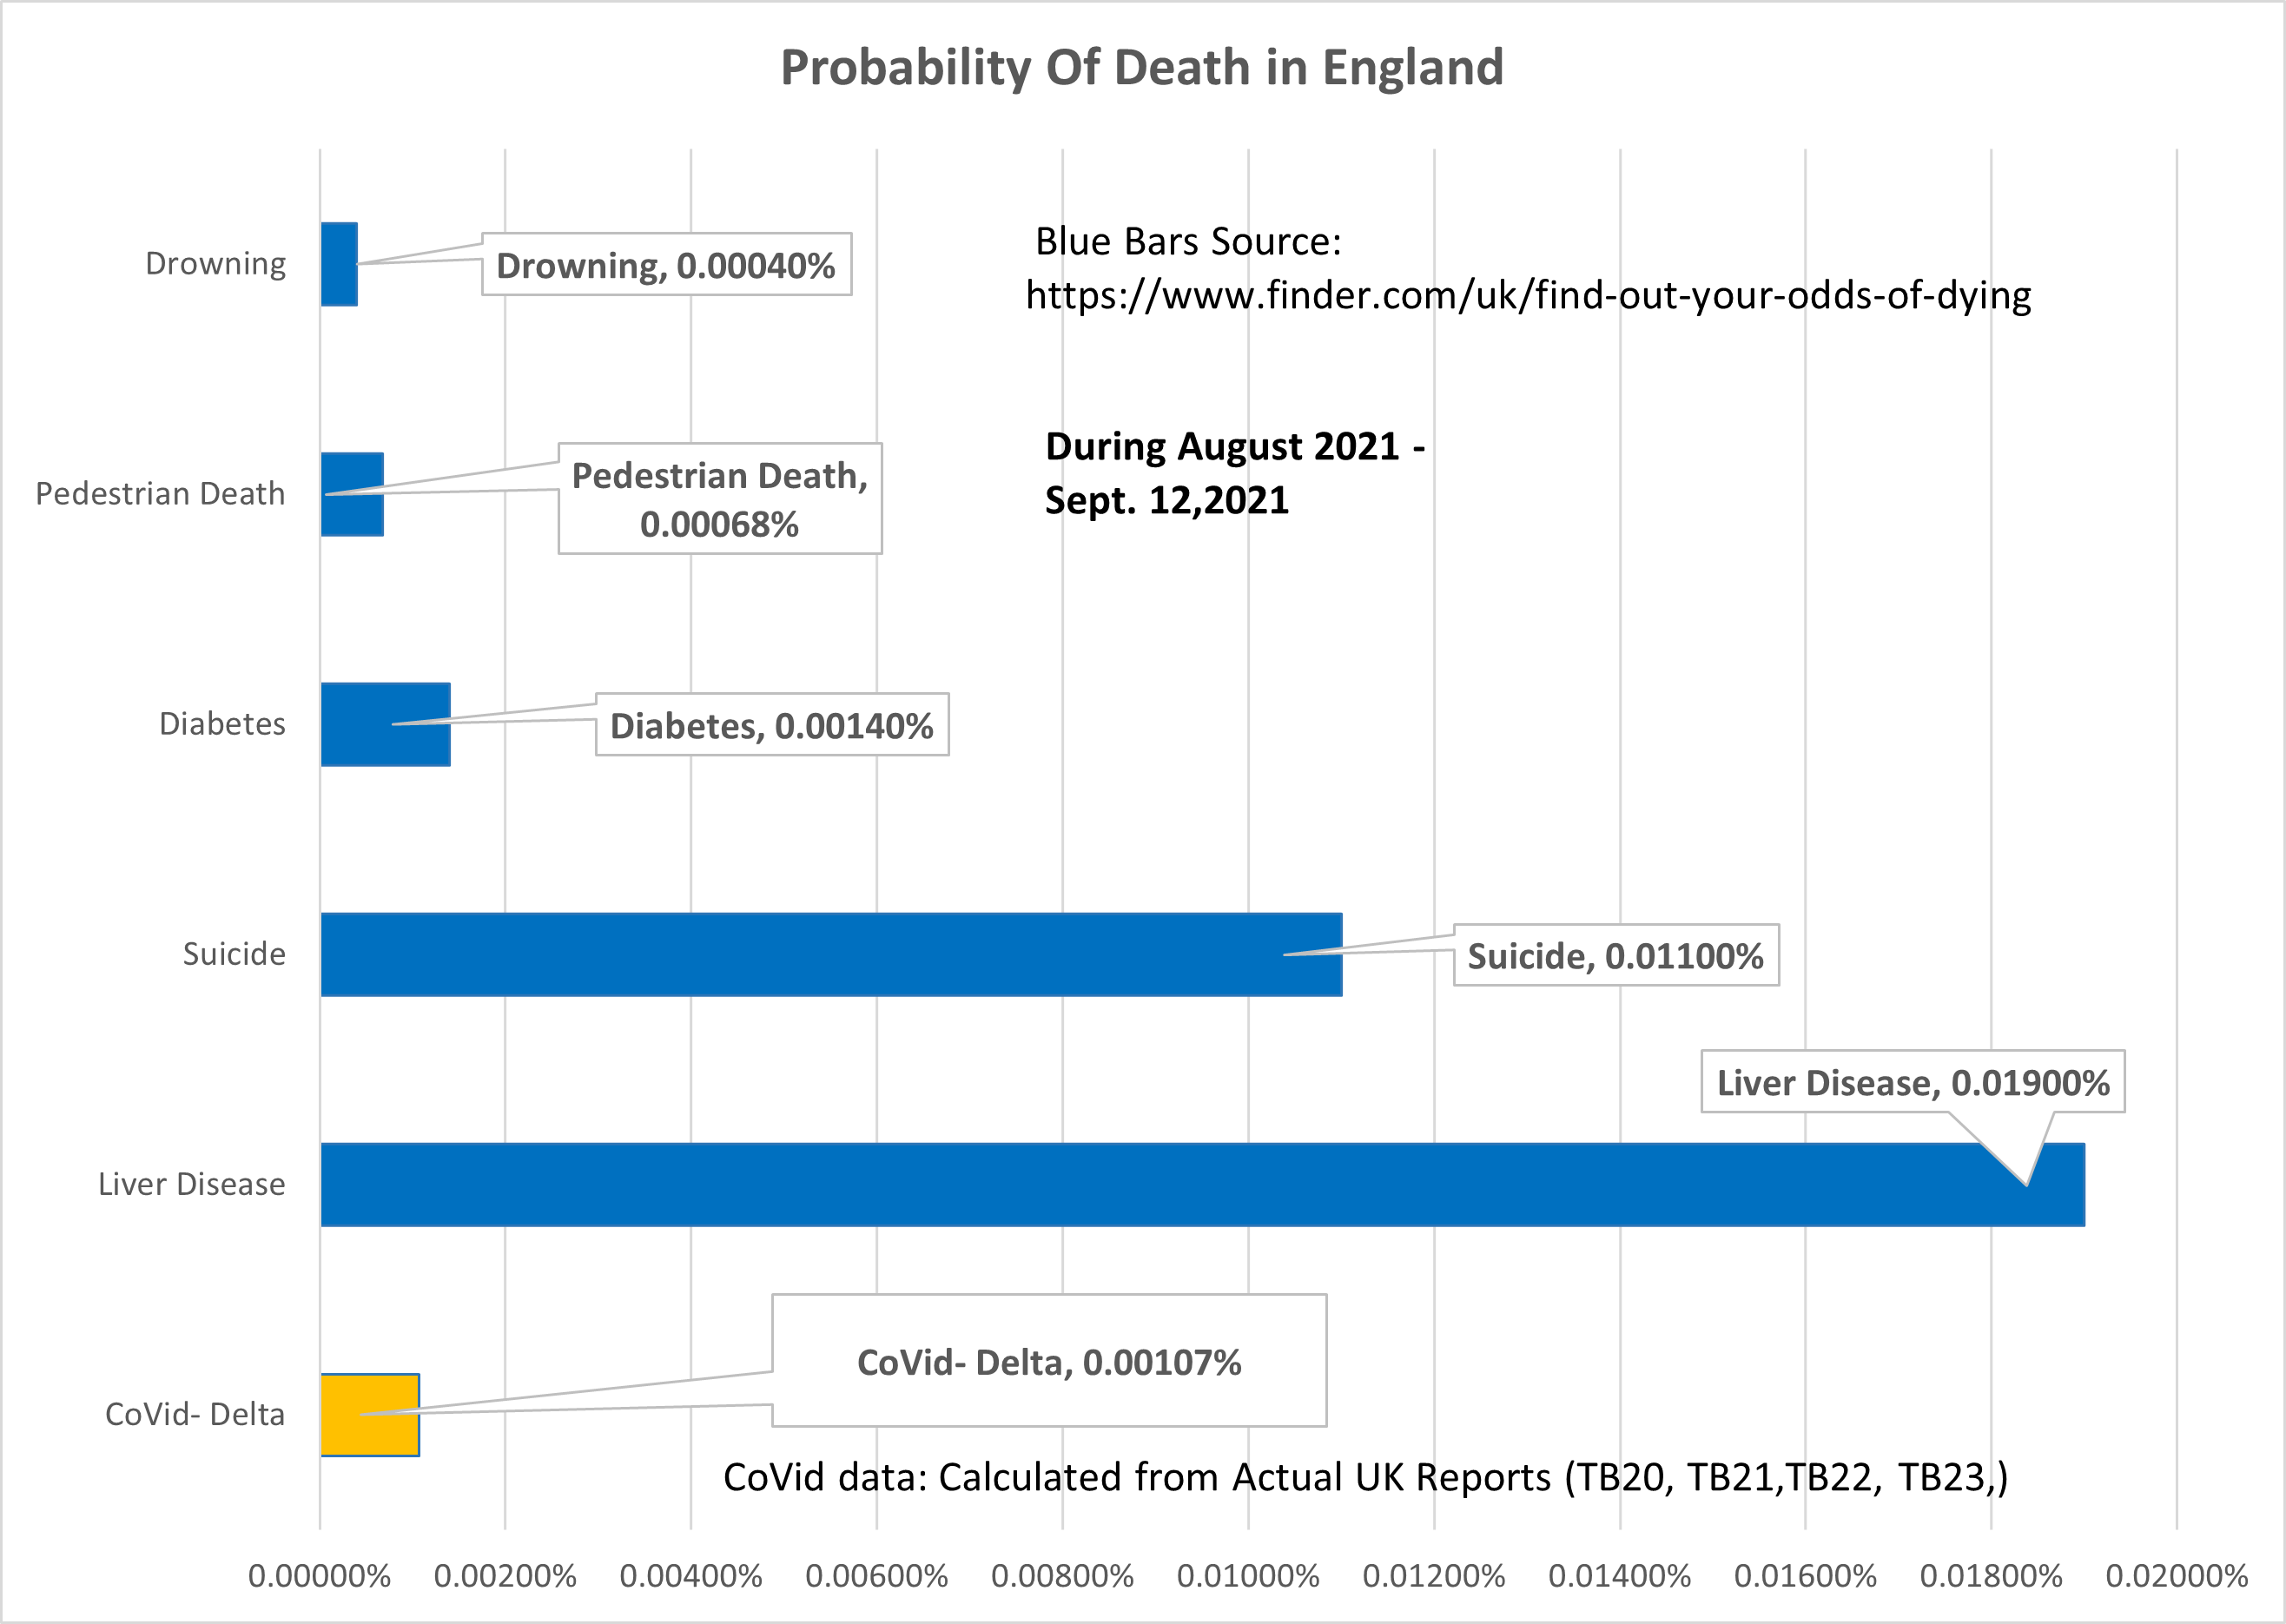
Source:SARS-CoV-2 variants of concern and variants under investigation in England. Technical Briefing 20, 21, 22, 23.
These results show that a English resident had a similar probability of being killed while a pedestrian, as dying of the CoVid Delta variant from August 2021- 12 September 2021.
Where can one find such powerful information?
Finding this data is somewhat challenging. We could find no single report that gives this data easily. In fact, to get this data, one must have at least two sequential reports.
| Technical Briefing 20 - 6 August 2021 |
Technical Briefing 21 - 20 August 2021 |
 |
 |
| Technical Briefing 22 - 3 September 2021 |
Technical Briefing 23 - 17 September 2021 |
 |
 |
Why do you need sequential reports to uncover this information?
| What is the information needed ? |
Why this is important? |
| 1.) The Reports contain TOTAL counts from 1 February 2021. They DO NOT contain CHANGES in the counts for the specified time period. |
1.) This will have the effect of OVERSTATING all of the Unvaccinated Figures. First doses of the Vaccine were only offered to people over 50 by mid-April of 2021. |
| 2.) Changes in counts MUST be calculated between two consecutive reports. |
2.) The marginal change (the difference between the same data item on two sequential reports) gives a more accurate figure for timely comparison. |
| 3.) Age breakouts for many categories are important. Vaccinations in England were only offered by mid-April 2021 for people 50 years of age and older. |
3.) Since people over 50 were only offered the first dose by mid-April 2021, unvaccinated comparisons cannot honestly be made before that time. This further requires calculating the real counts that occured during a specific timeframe. (between 2 consecutive reports). |
| 4.) Under 50 years old Age breakouts for many categories are important. Vaccinations were only offered in England for People under 50 (18-49) by mid July 2021. |
4.) This makes the August/September data even more important for people under the age of 50. The impacts in number of cases among the vaccinated can be very powerful in providing the world with guidance. Under 50 Vaccinated people would have only had the vaccine inside them for less than 60 days. Any so-called "Breakthrough" infections in such a VERY short time since vaccination, may take on added significance. |
| |
|
Using the reasons above we gathered data from the four listed reports. Some of the results are below.
The Data from England teaches us a number of things.
First and foremost, we see the current phase IS NOT a pandemic of the "Unvaccinated".
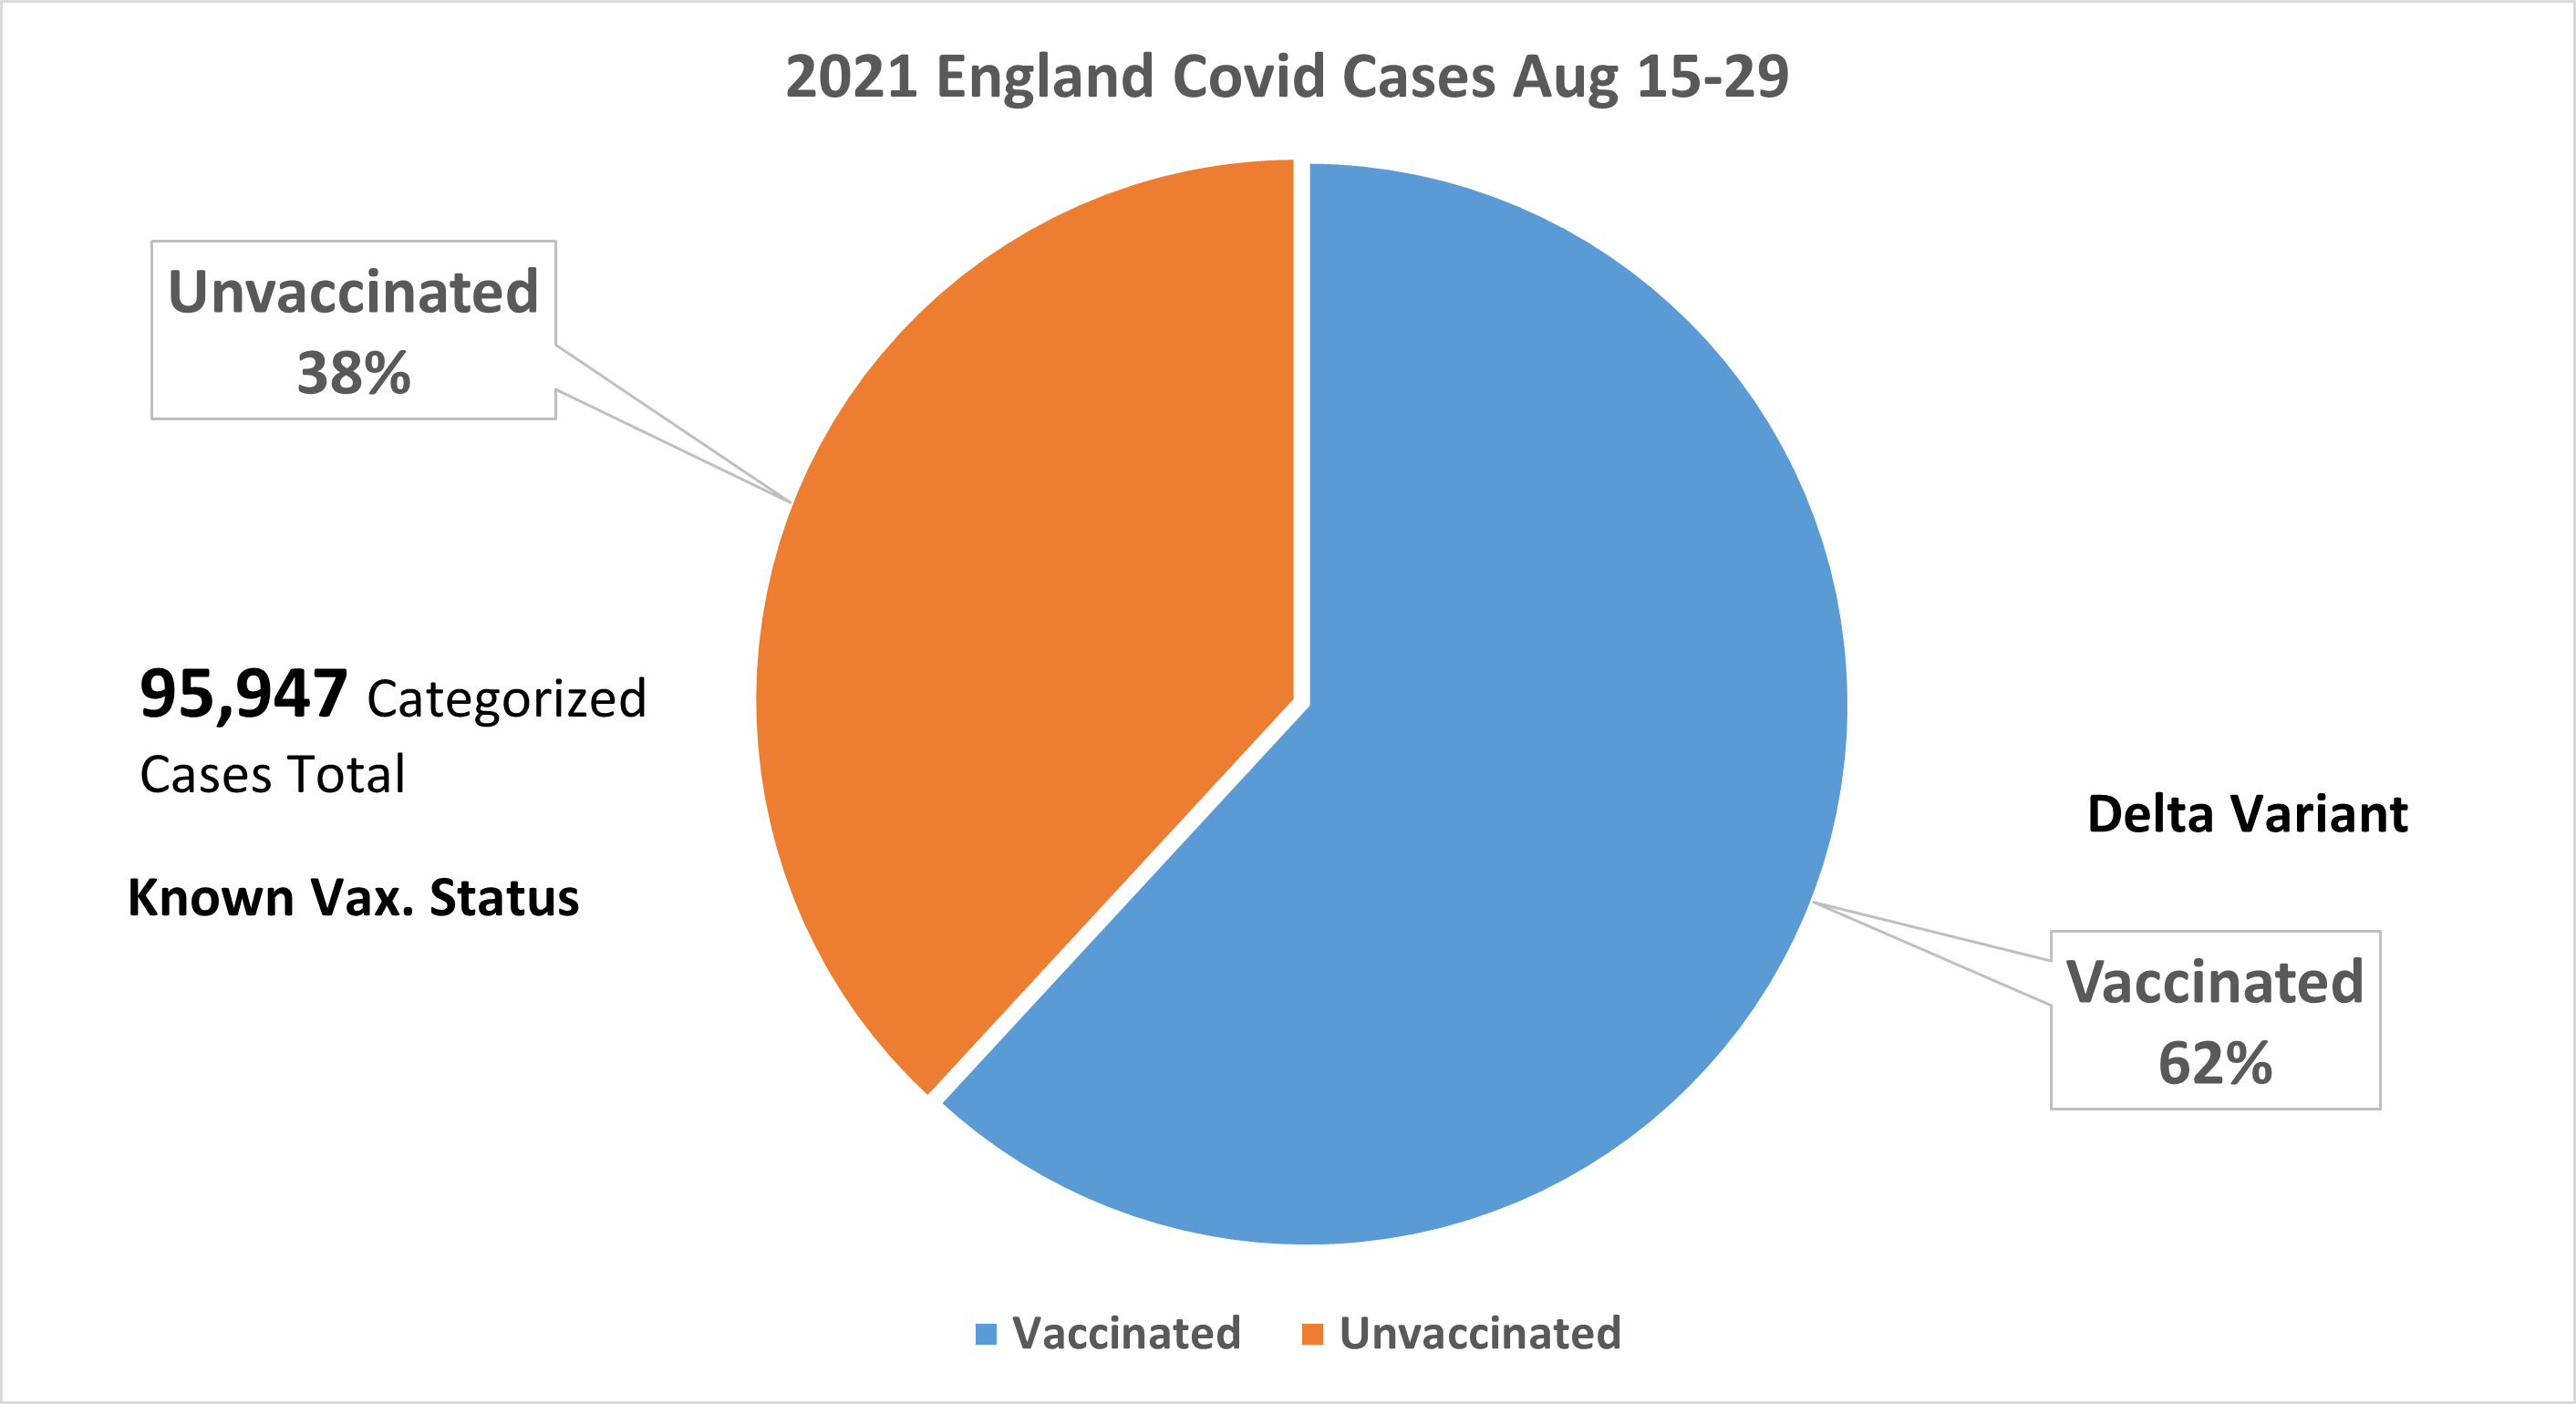
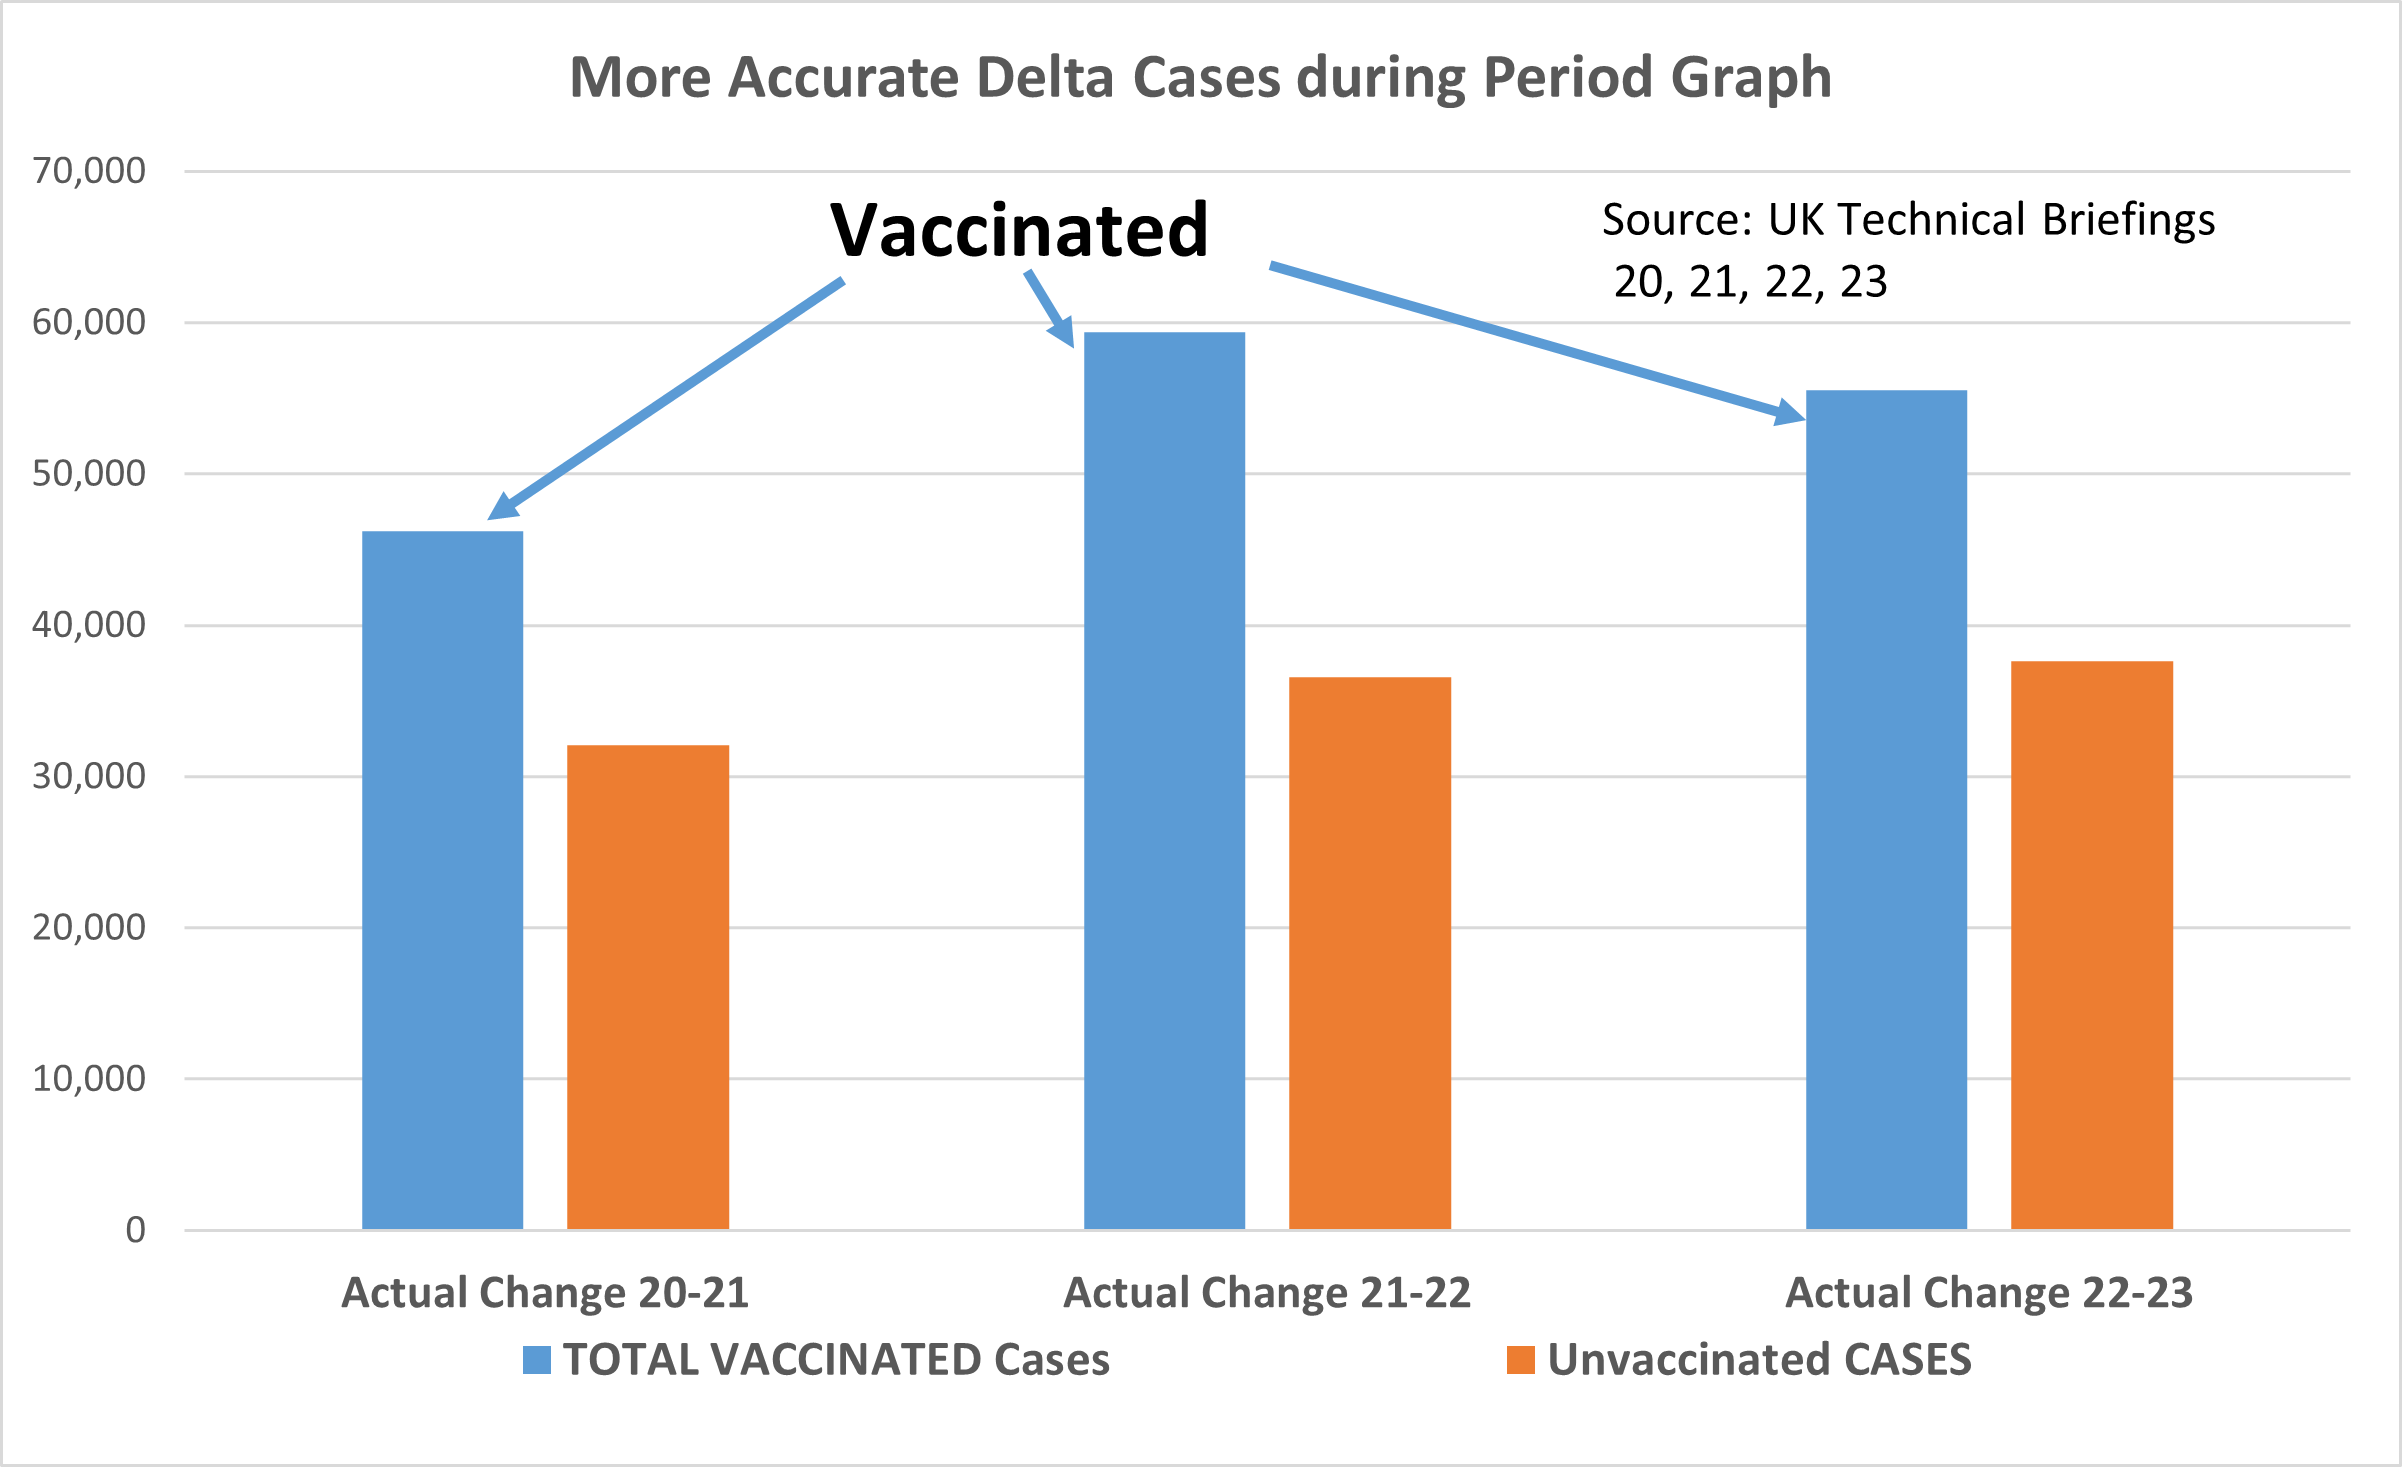
|
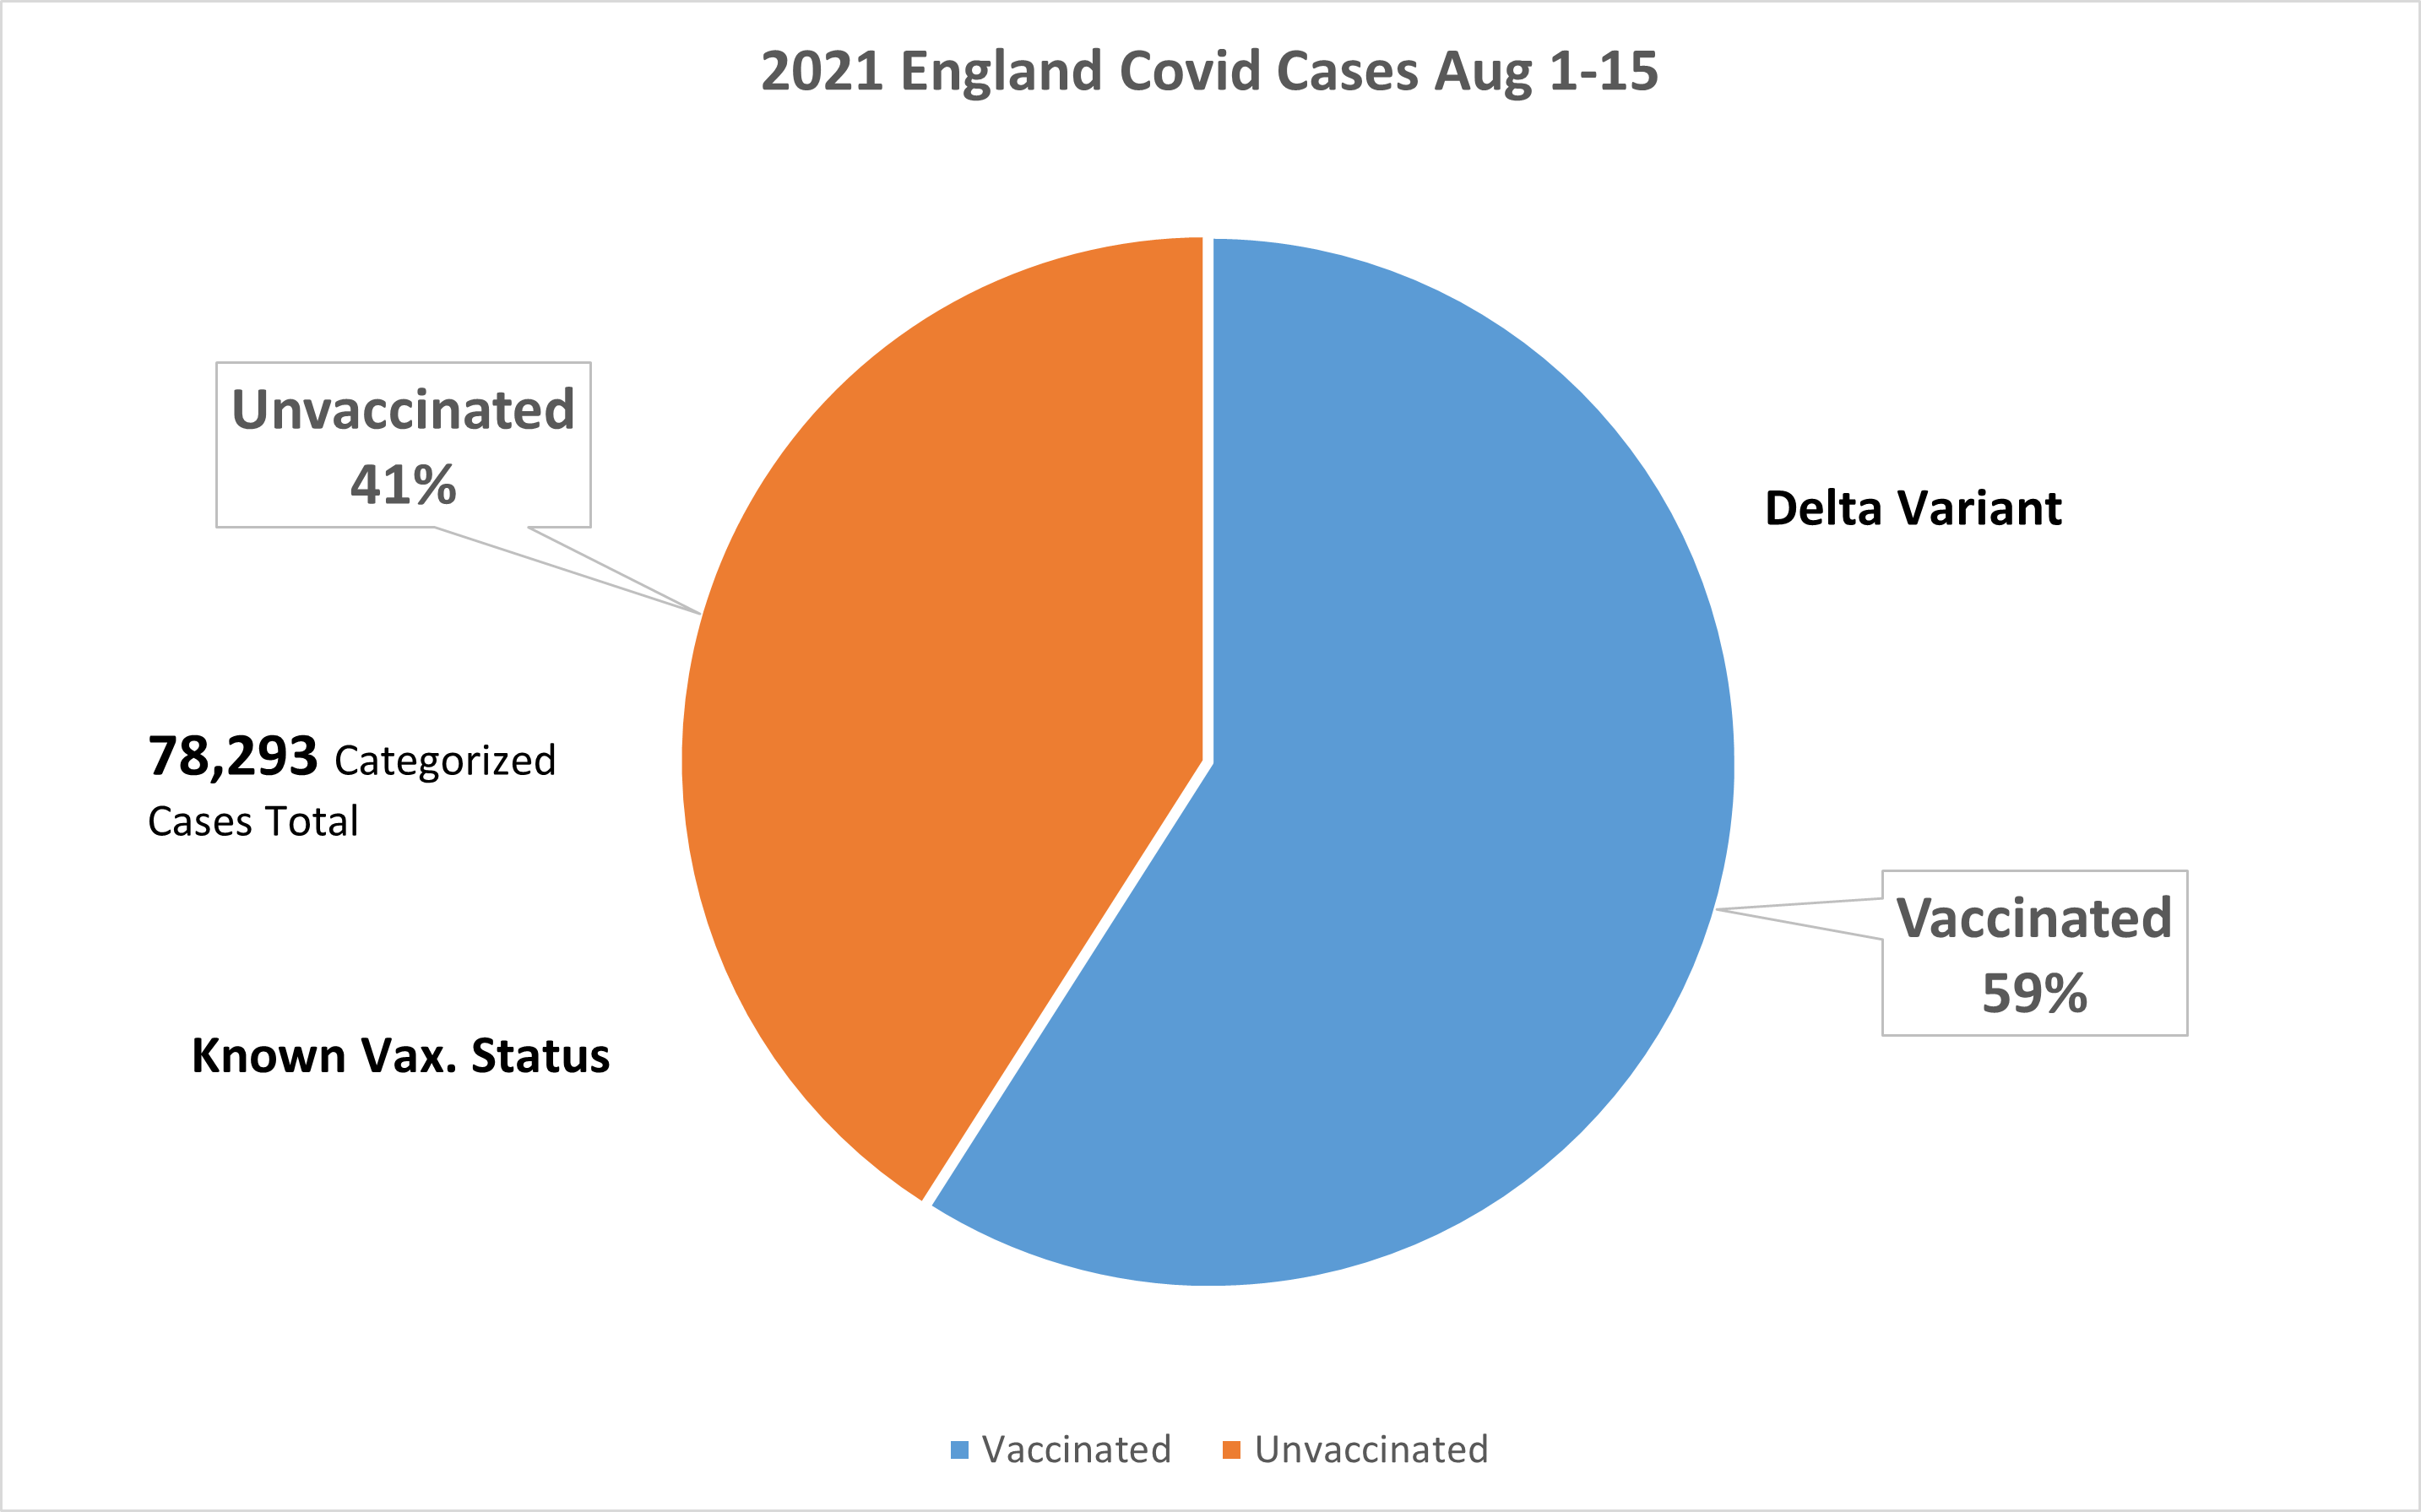
This shows the Case breakout for the first half of the month of August 2021.
- Note that the Vaccinated make up more than half of all Delta cases. |
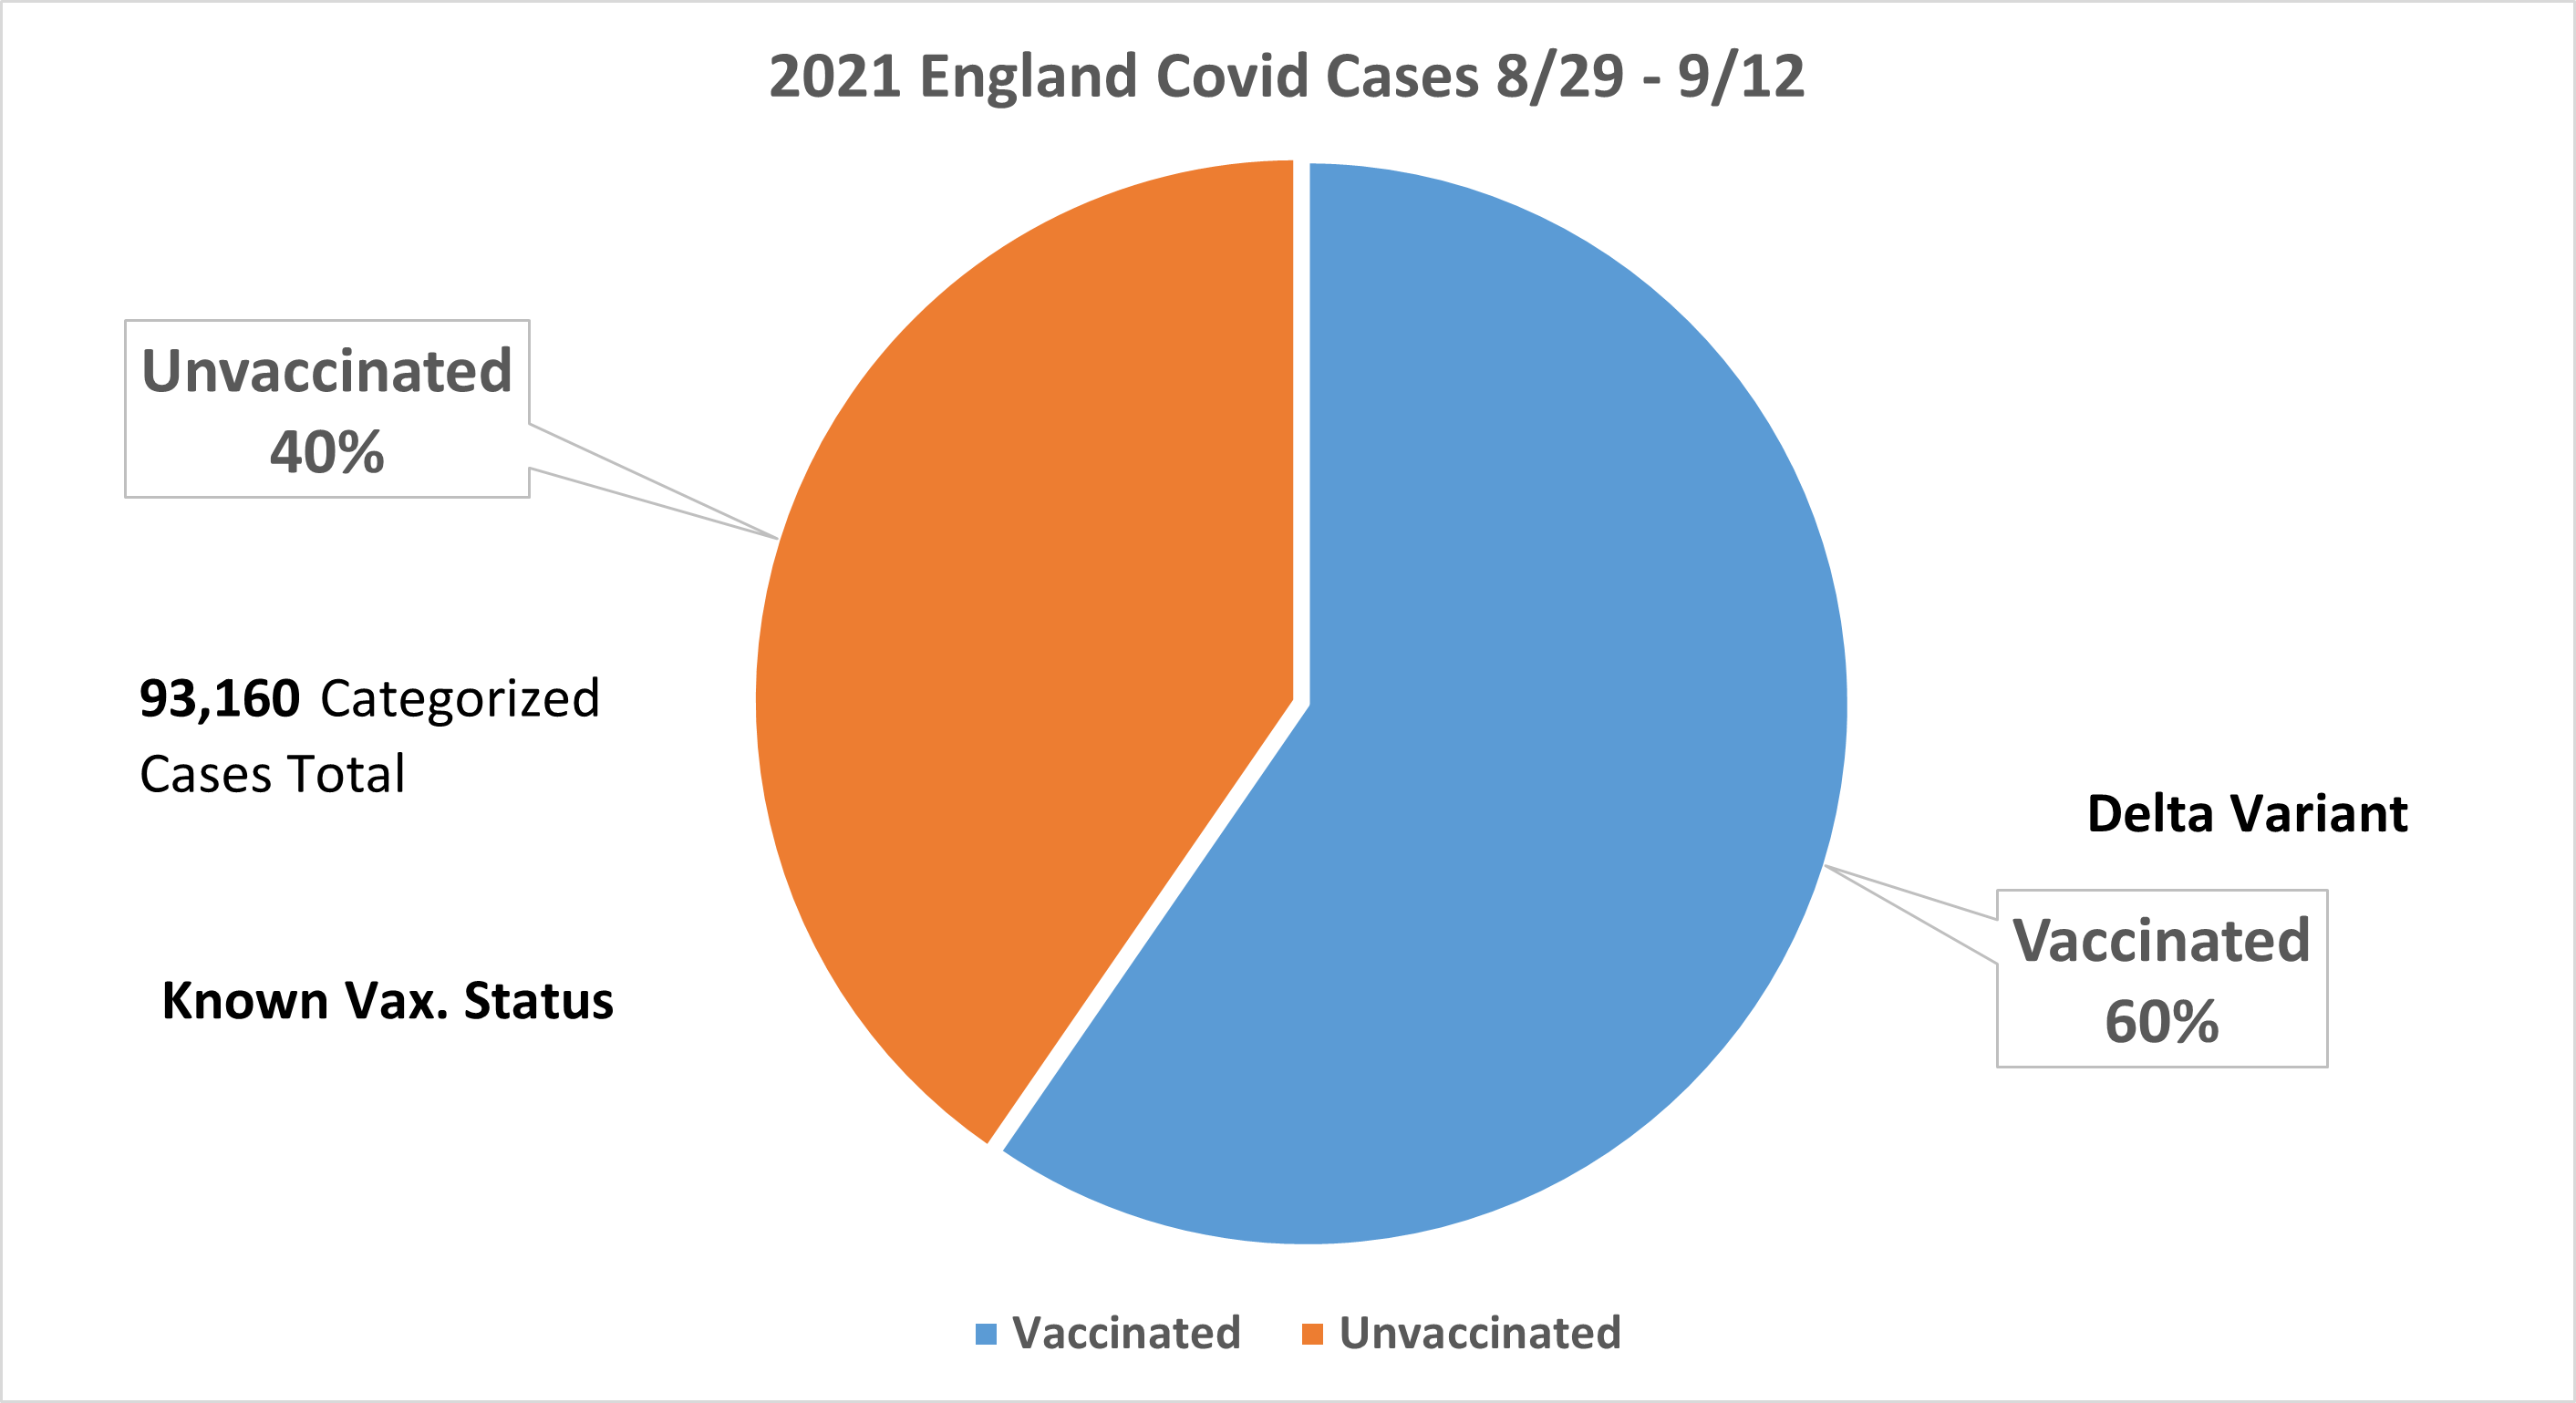
|
This shows the Case breakout for the second half of the month of August 2021.
- Note that the Vaccinated make up more than 60% of all Delta cases. |
|
The first half of September 2021 is very similar. |
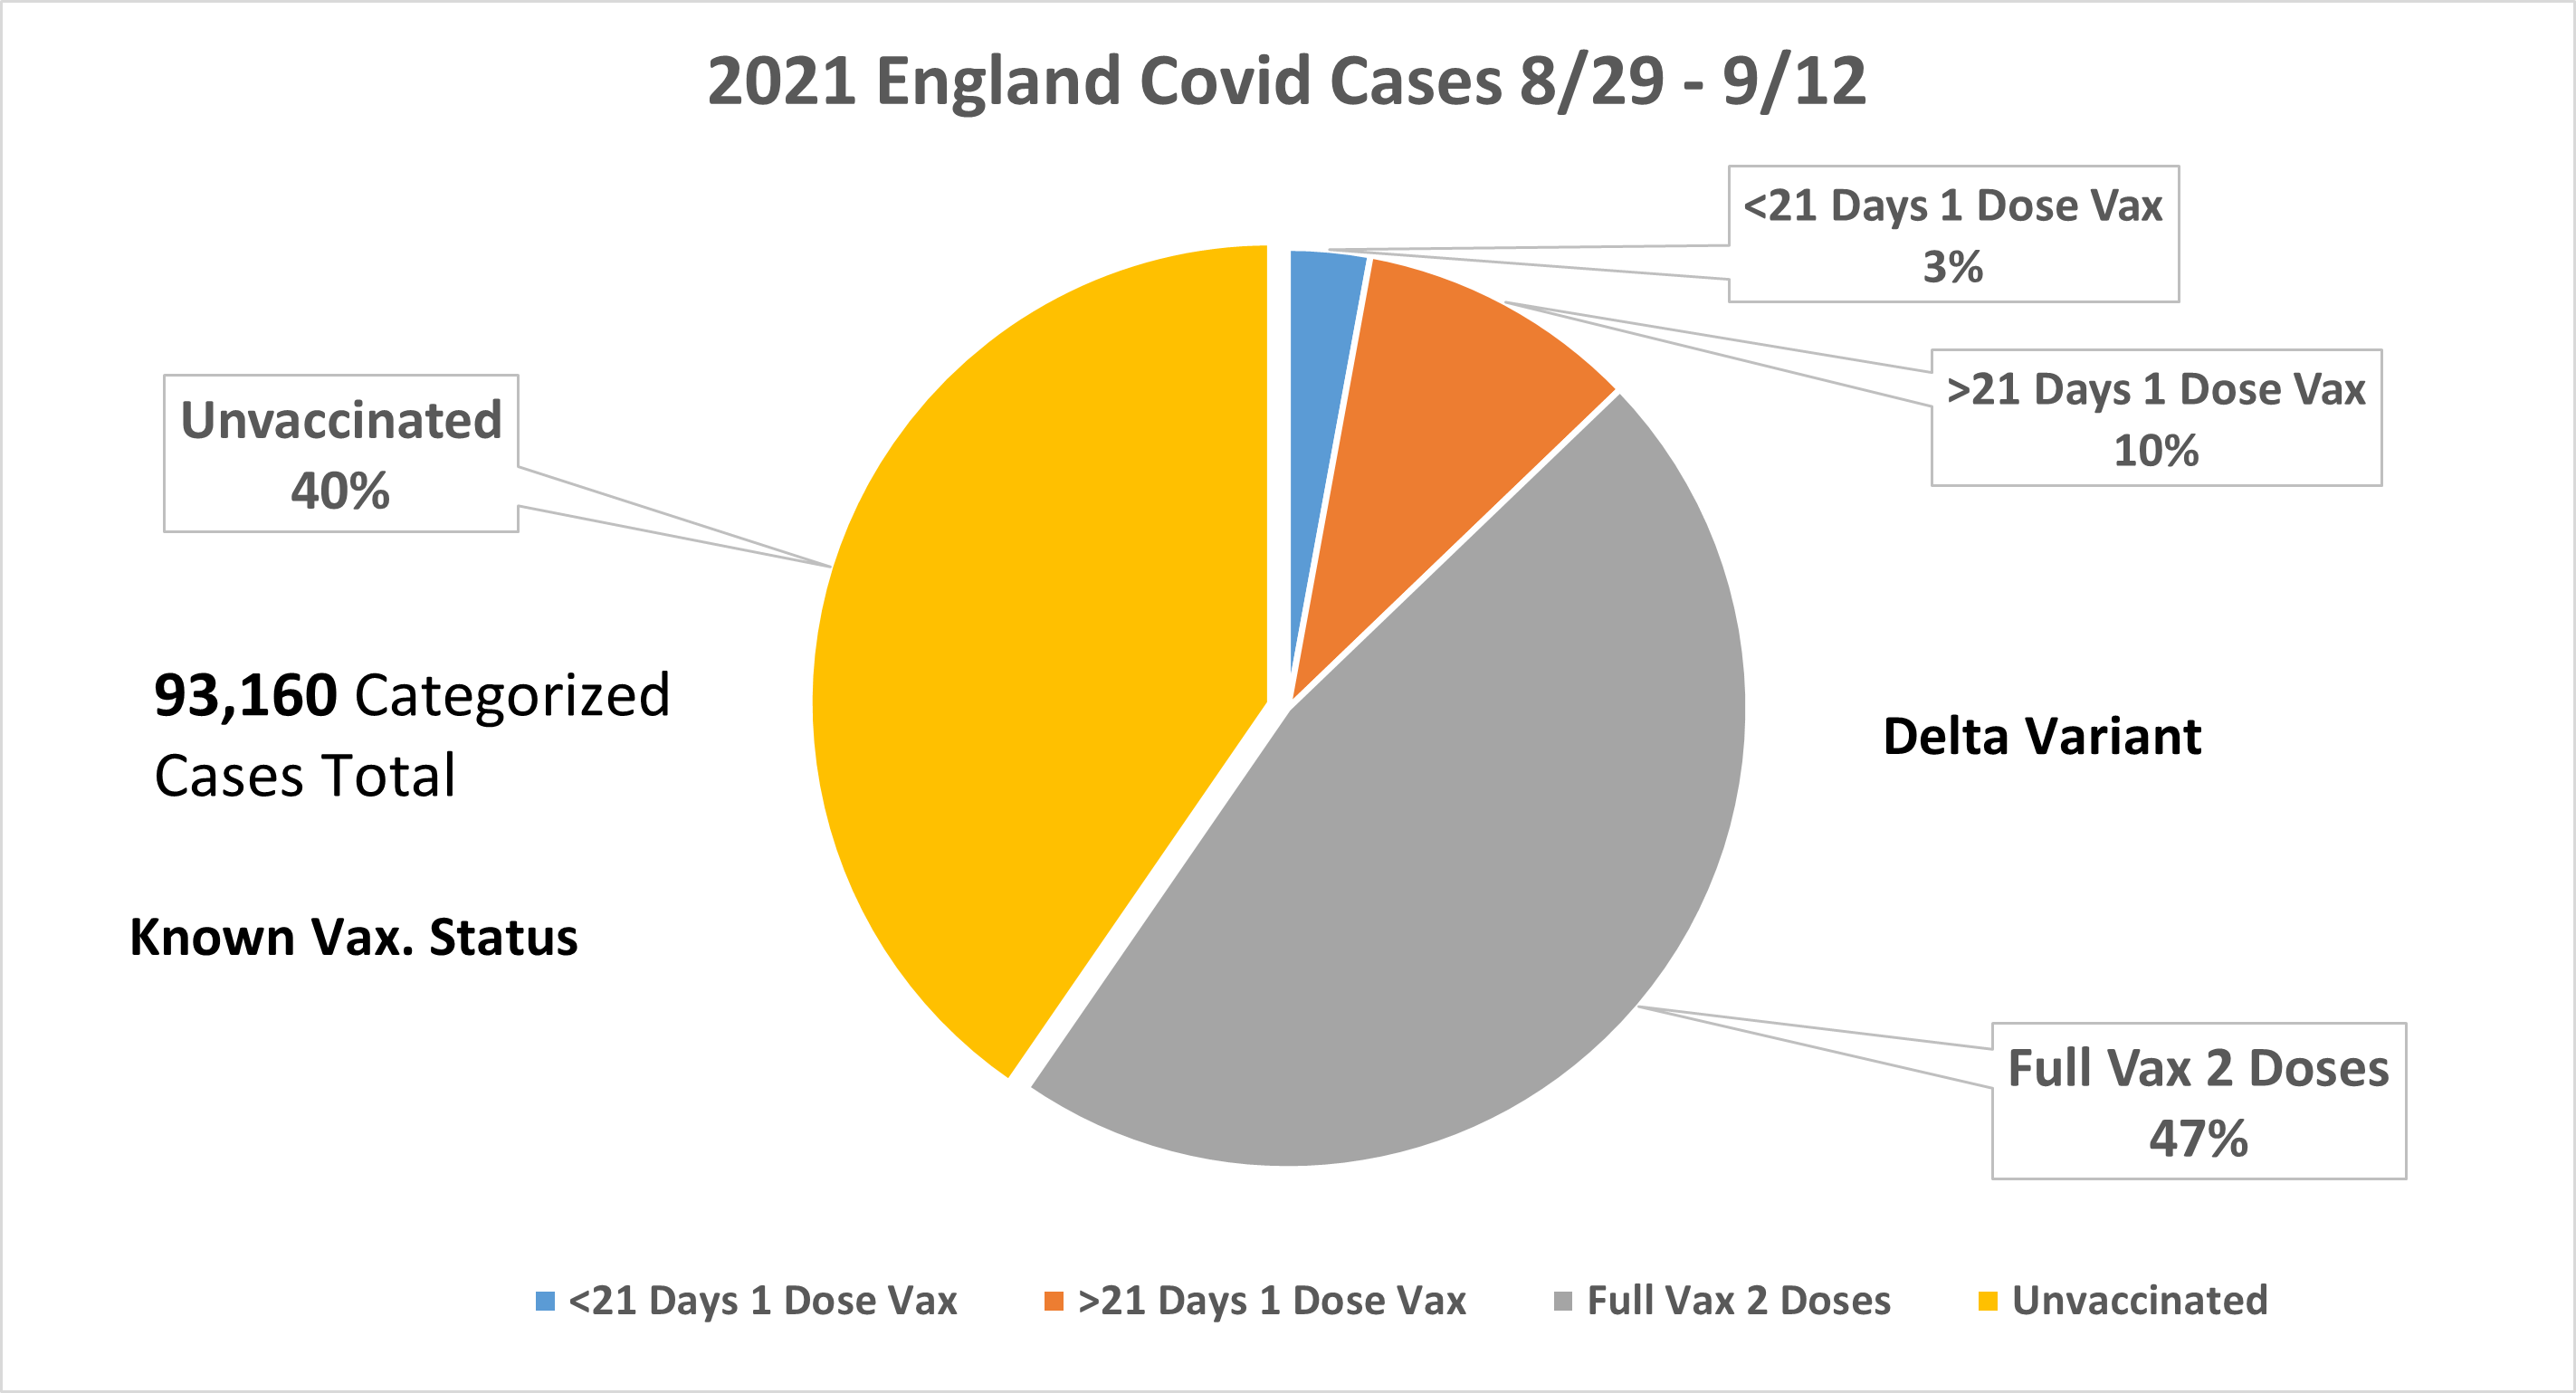
|
It is not just Partially Vaccinated that are contracting the Delta variant.
Fully Vaccinated people make up 47% of the cases. (More than the unvaccinated) |
| Source for all above :SARS-CoV-2 variants of concern and variants under investigation in England. Technical Briefing 20, 21, 22, 23 |
Clearly the cases show this is NOT a pandemic of the "unvaccinated".
But, what about Deaths?
Actual Deaths from the CoVid Delta variant, in England, may be even more stunning.
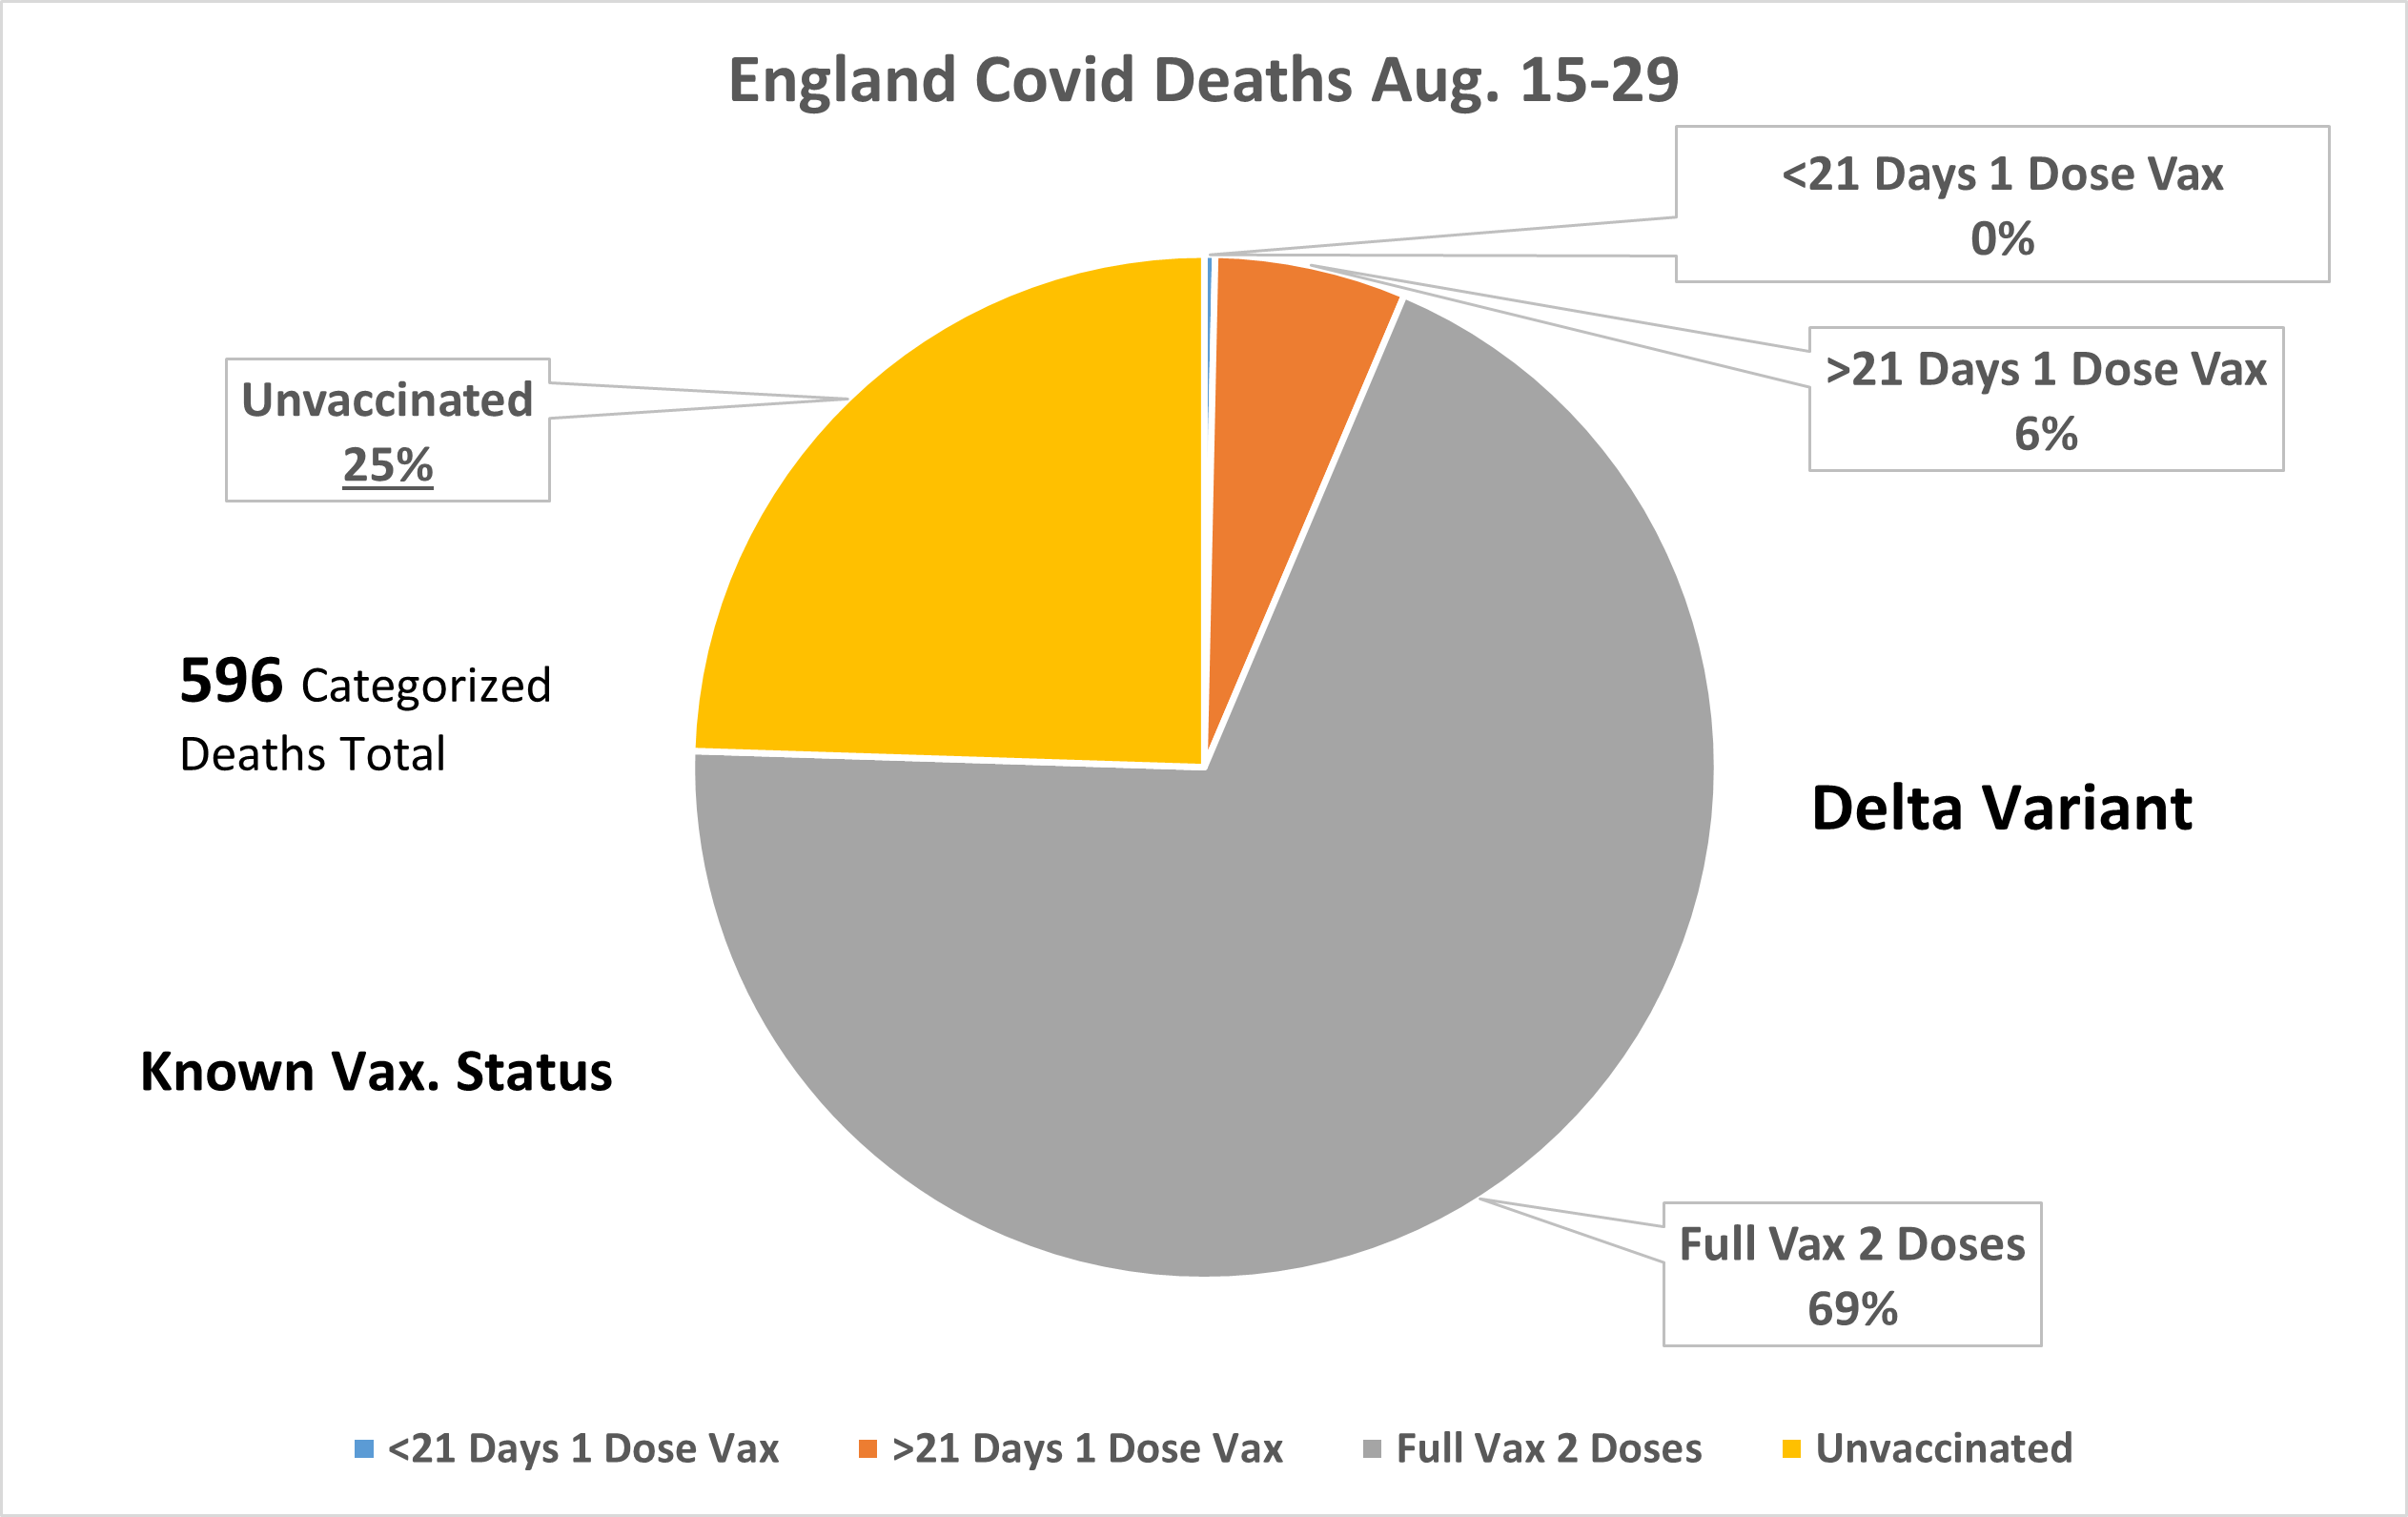
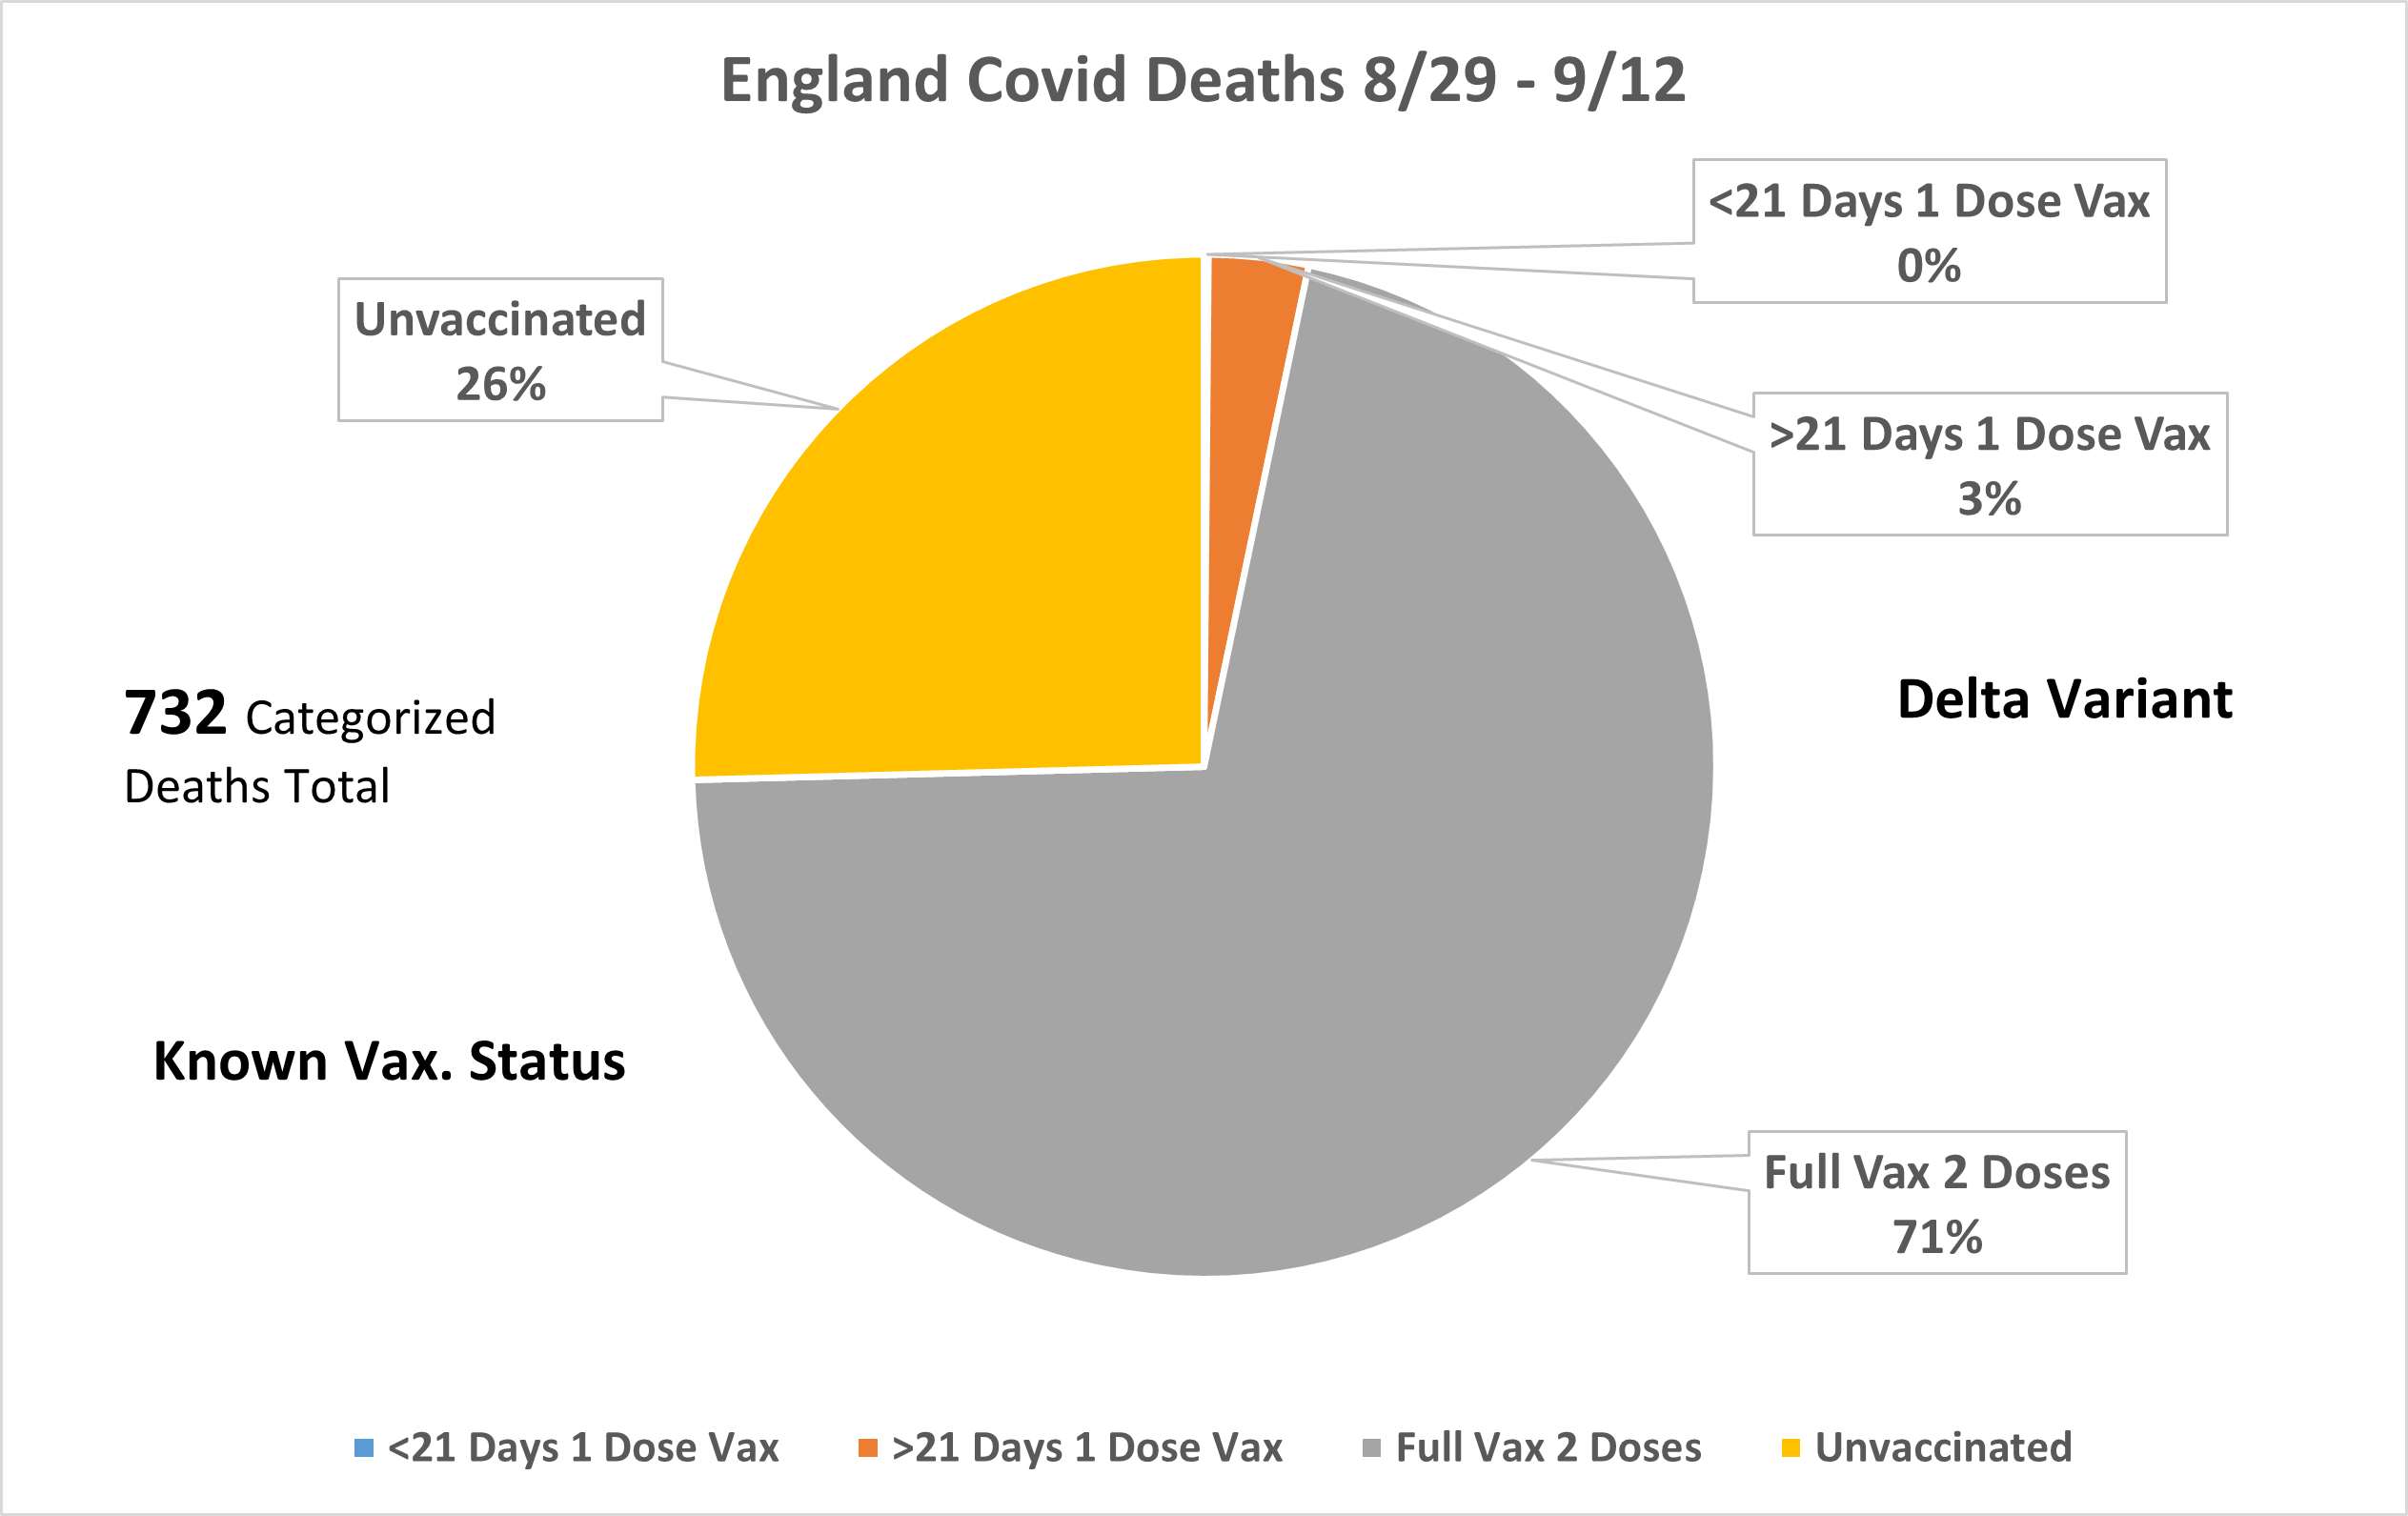
What is the actual breakout of Deaths in England by Vaccination status?
|
|
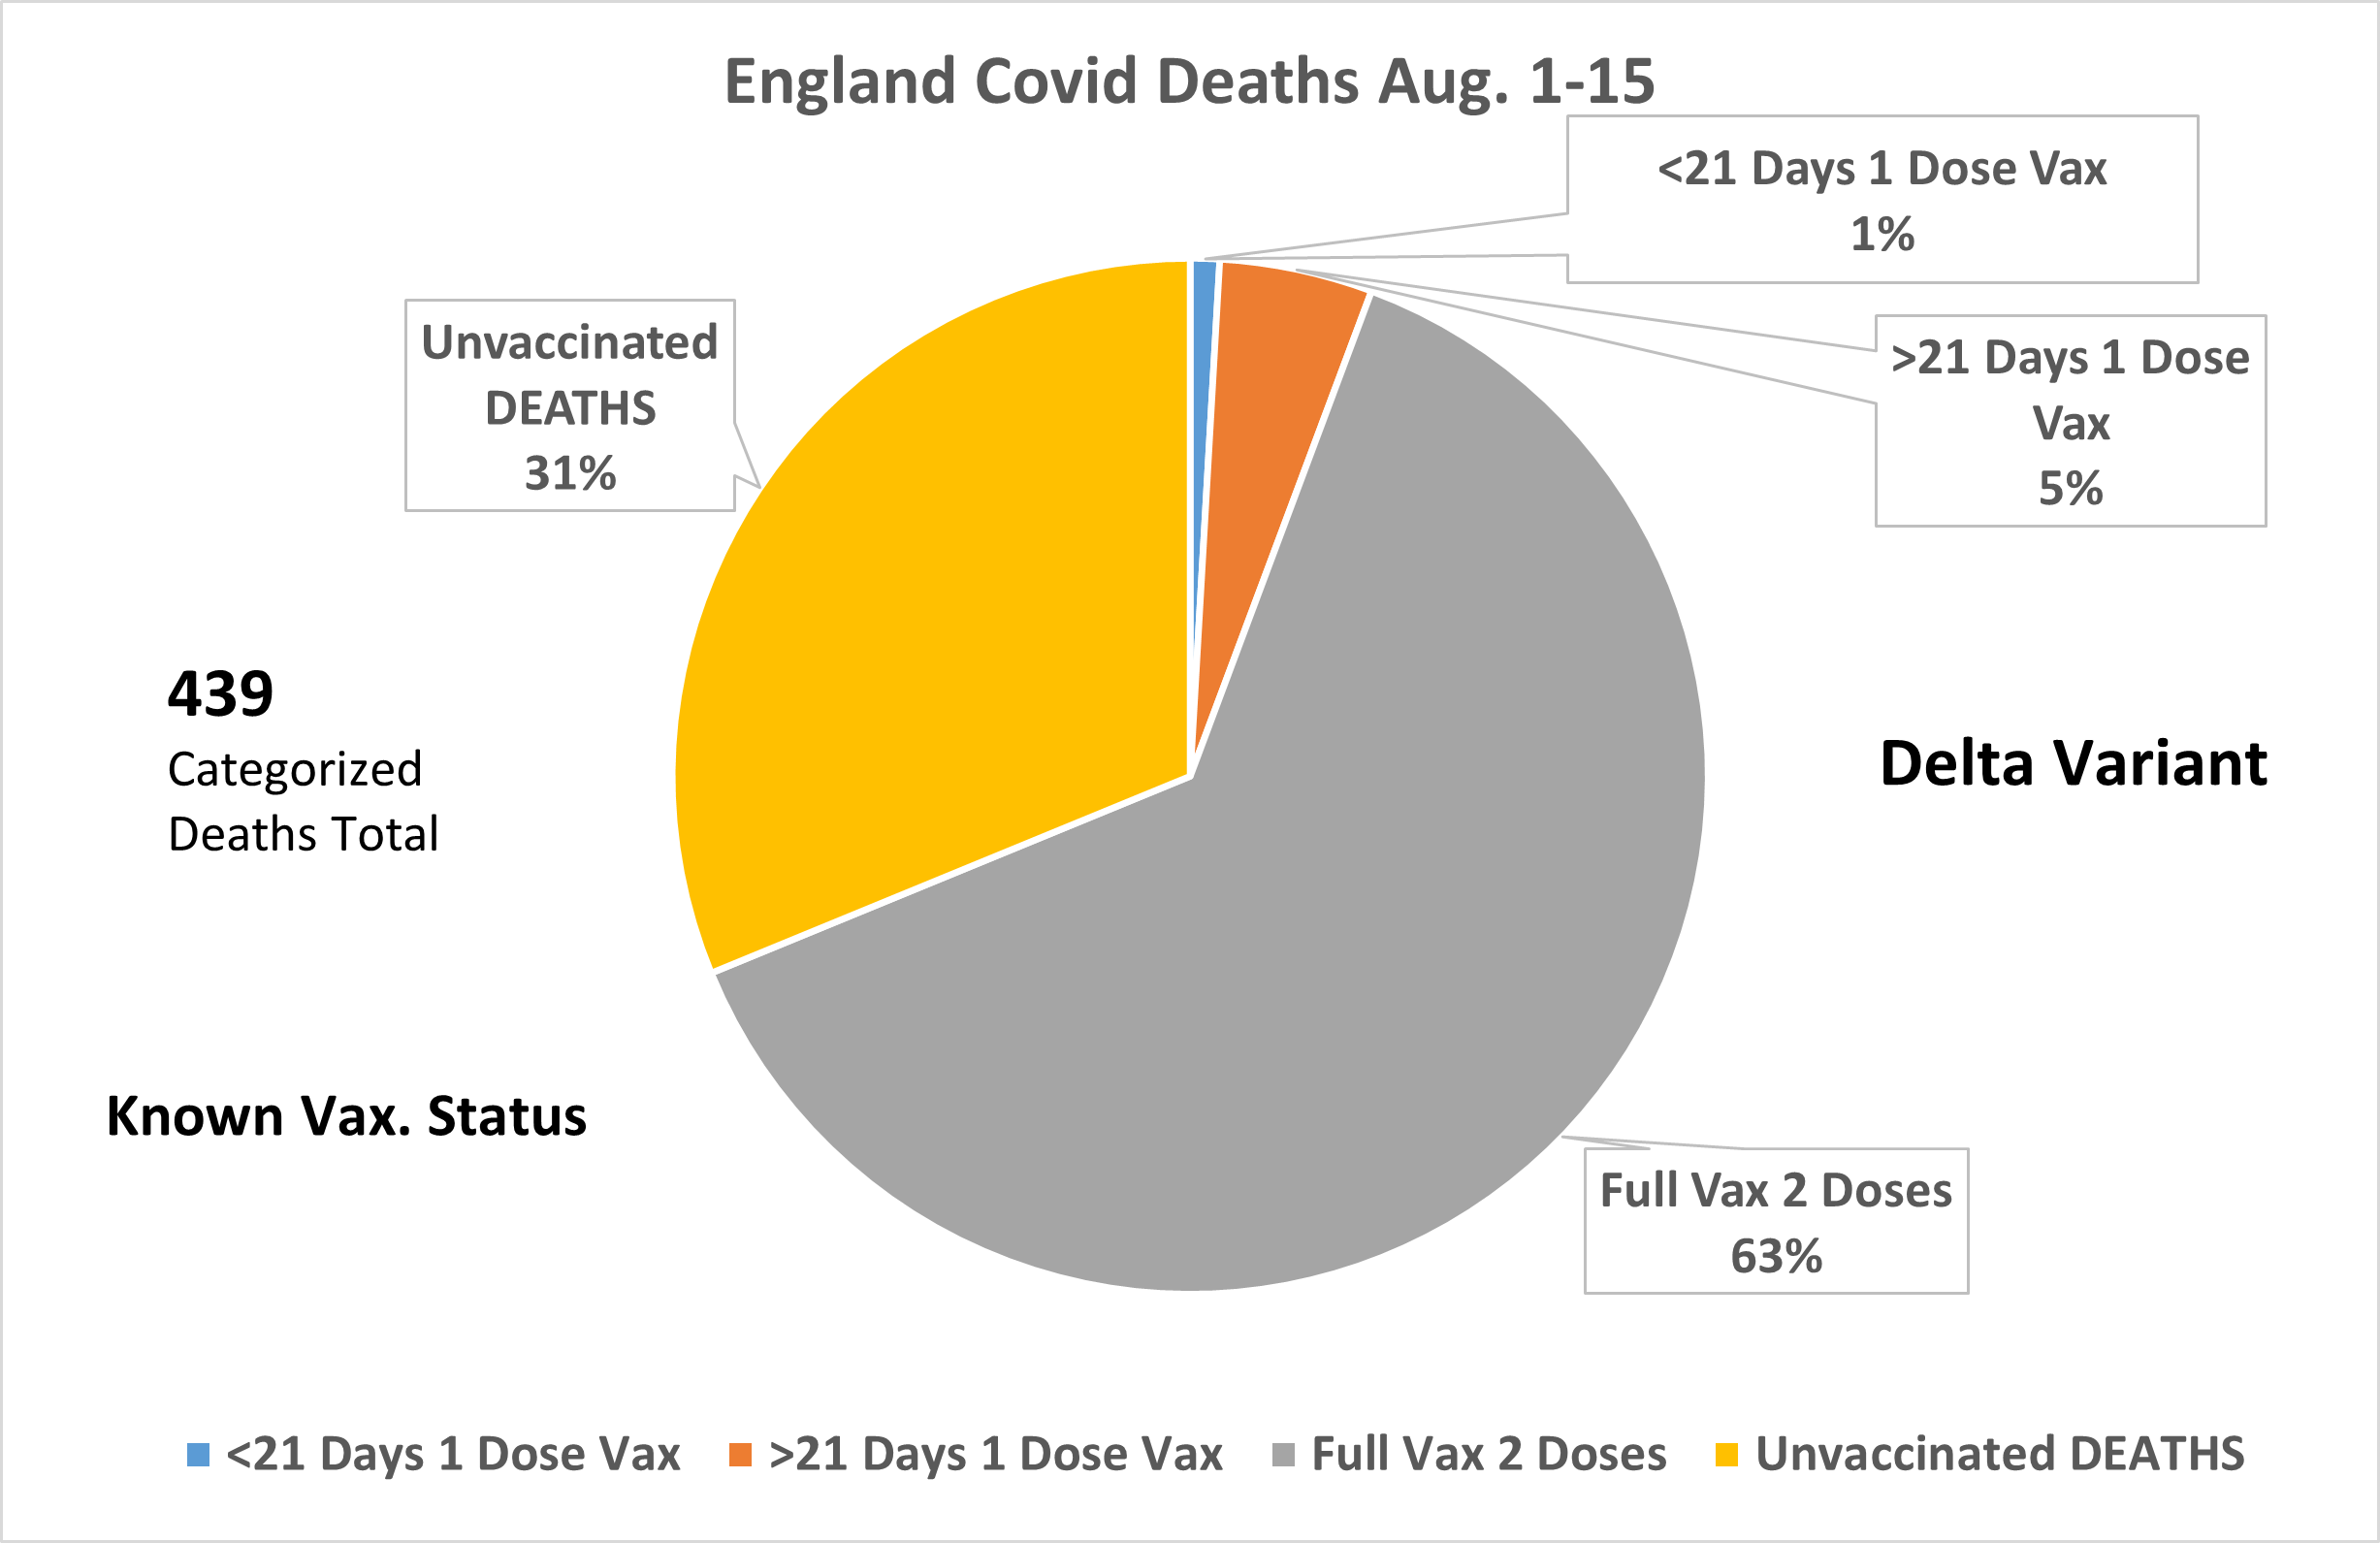
This seems counter intuitive because traditional Vaccines are supposed to prevent death. |
Keys:
1.) 63% of the Deaths were among The Fully Vaccinated.
2.) 31% of the Deaths were among The Unvaccinated.
|
|
Keys:
1.) 69% of the Deaths were among The Fully Vaccinated.
2.) Only 25% of the Deaths were among The Unvaccinated.
|
|
Keys:
1.) More than 70% of the Deaths were among The Fully Vaccinated.
2.) A total of 732 deaths were recorded.
|
Why haven't you seen this data before?
The data must be calculated from two sequential reports. Effort is required to retrieve it.
The reports structure may enable misleading information to be reported, because running totals are used.
Since the reports data was being gathered before vaccinations started, unvaccinated results will be overstated.
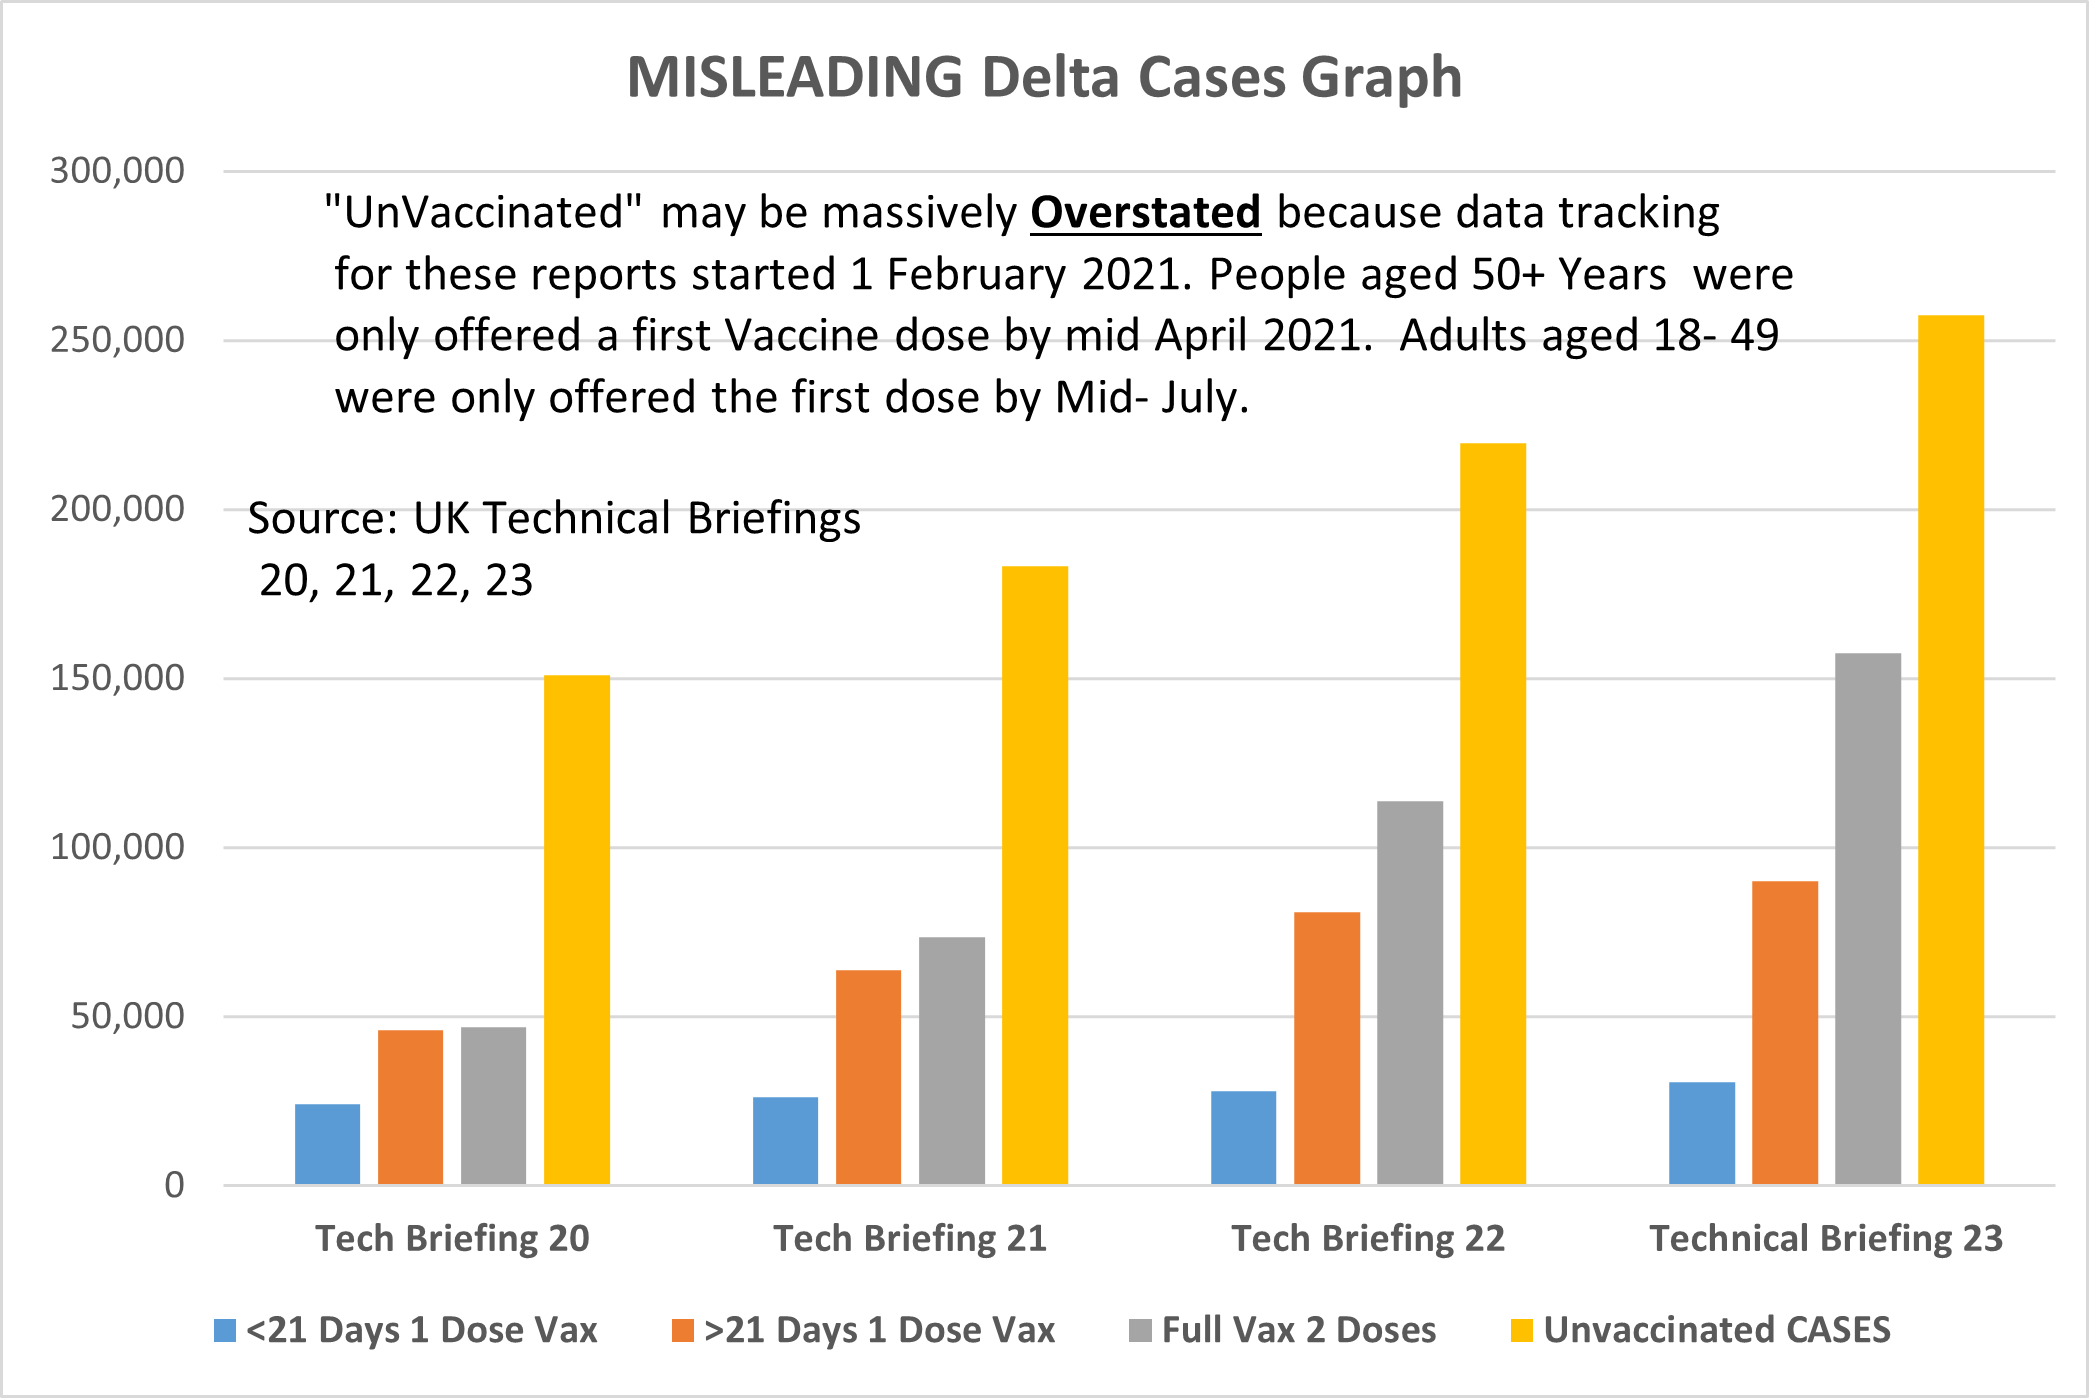
Here is an example of how that overstatement looks to the uninitiated person. The first graph below, is taken from printed data in the report,(without comparing two reports).
|
MISLEADING Cases DATA presentation
Keys:
1.) Notice how the unvaccinated bar appears much longer.
2.) This may lead people to wrongly believe that: "This is a pandemic of the unvaccinated."
|
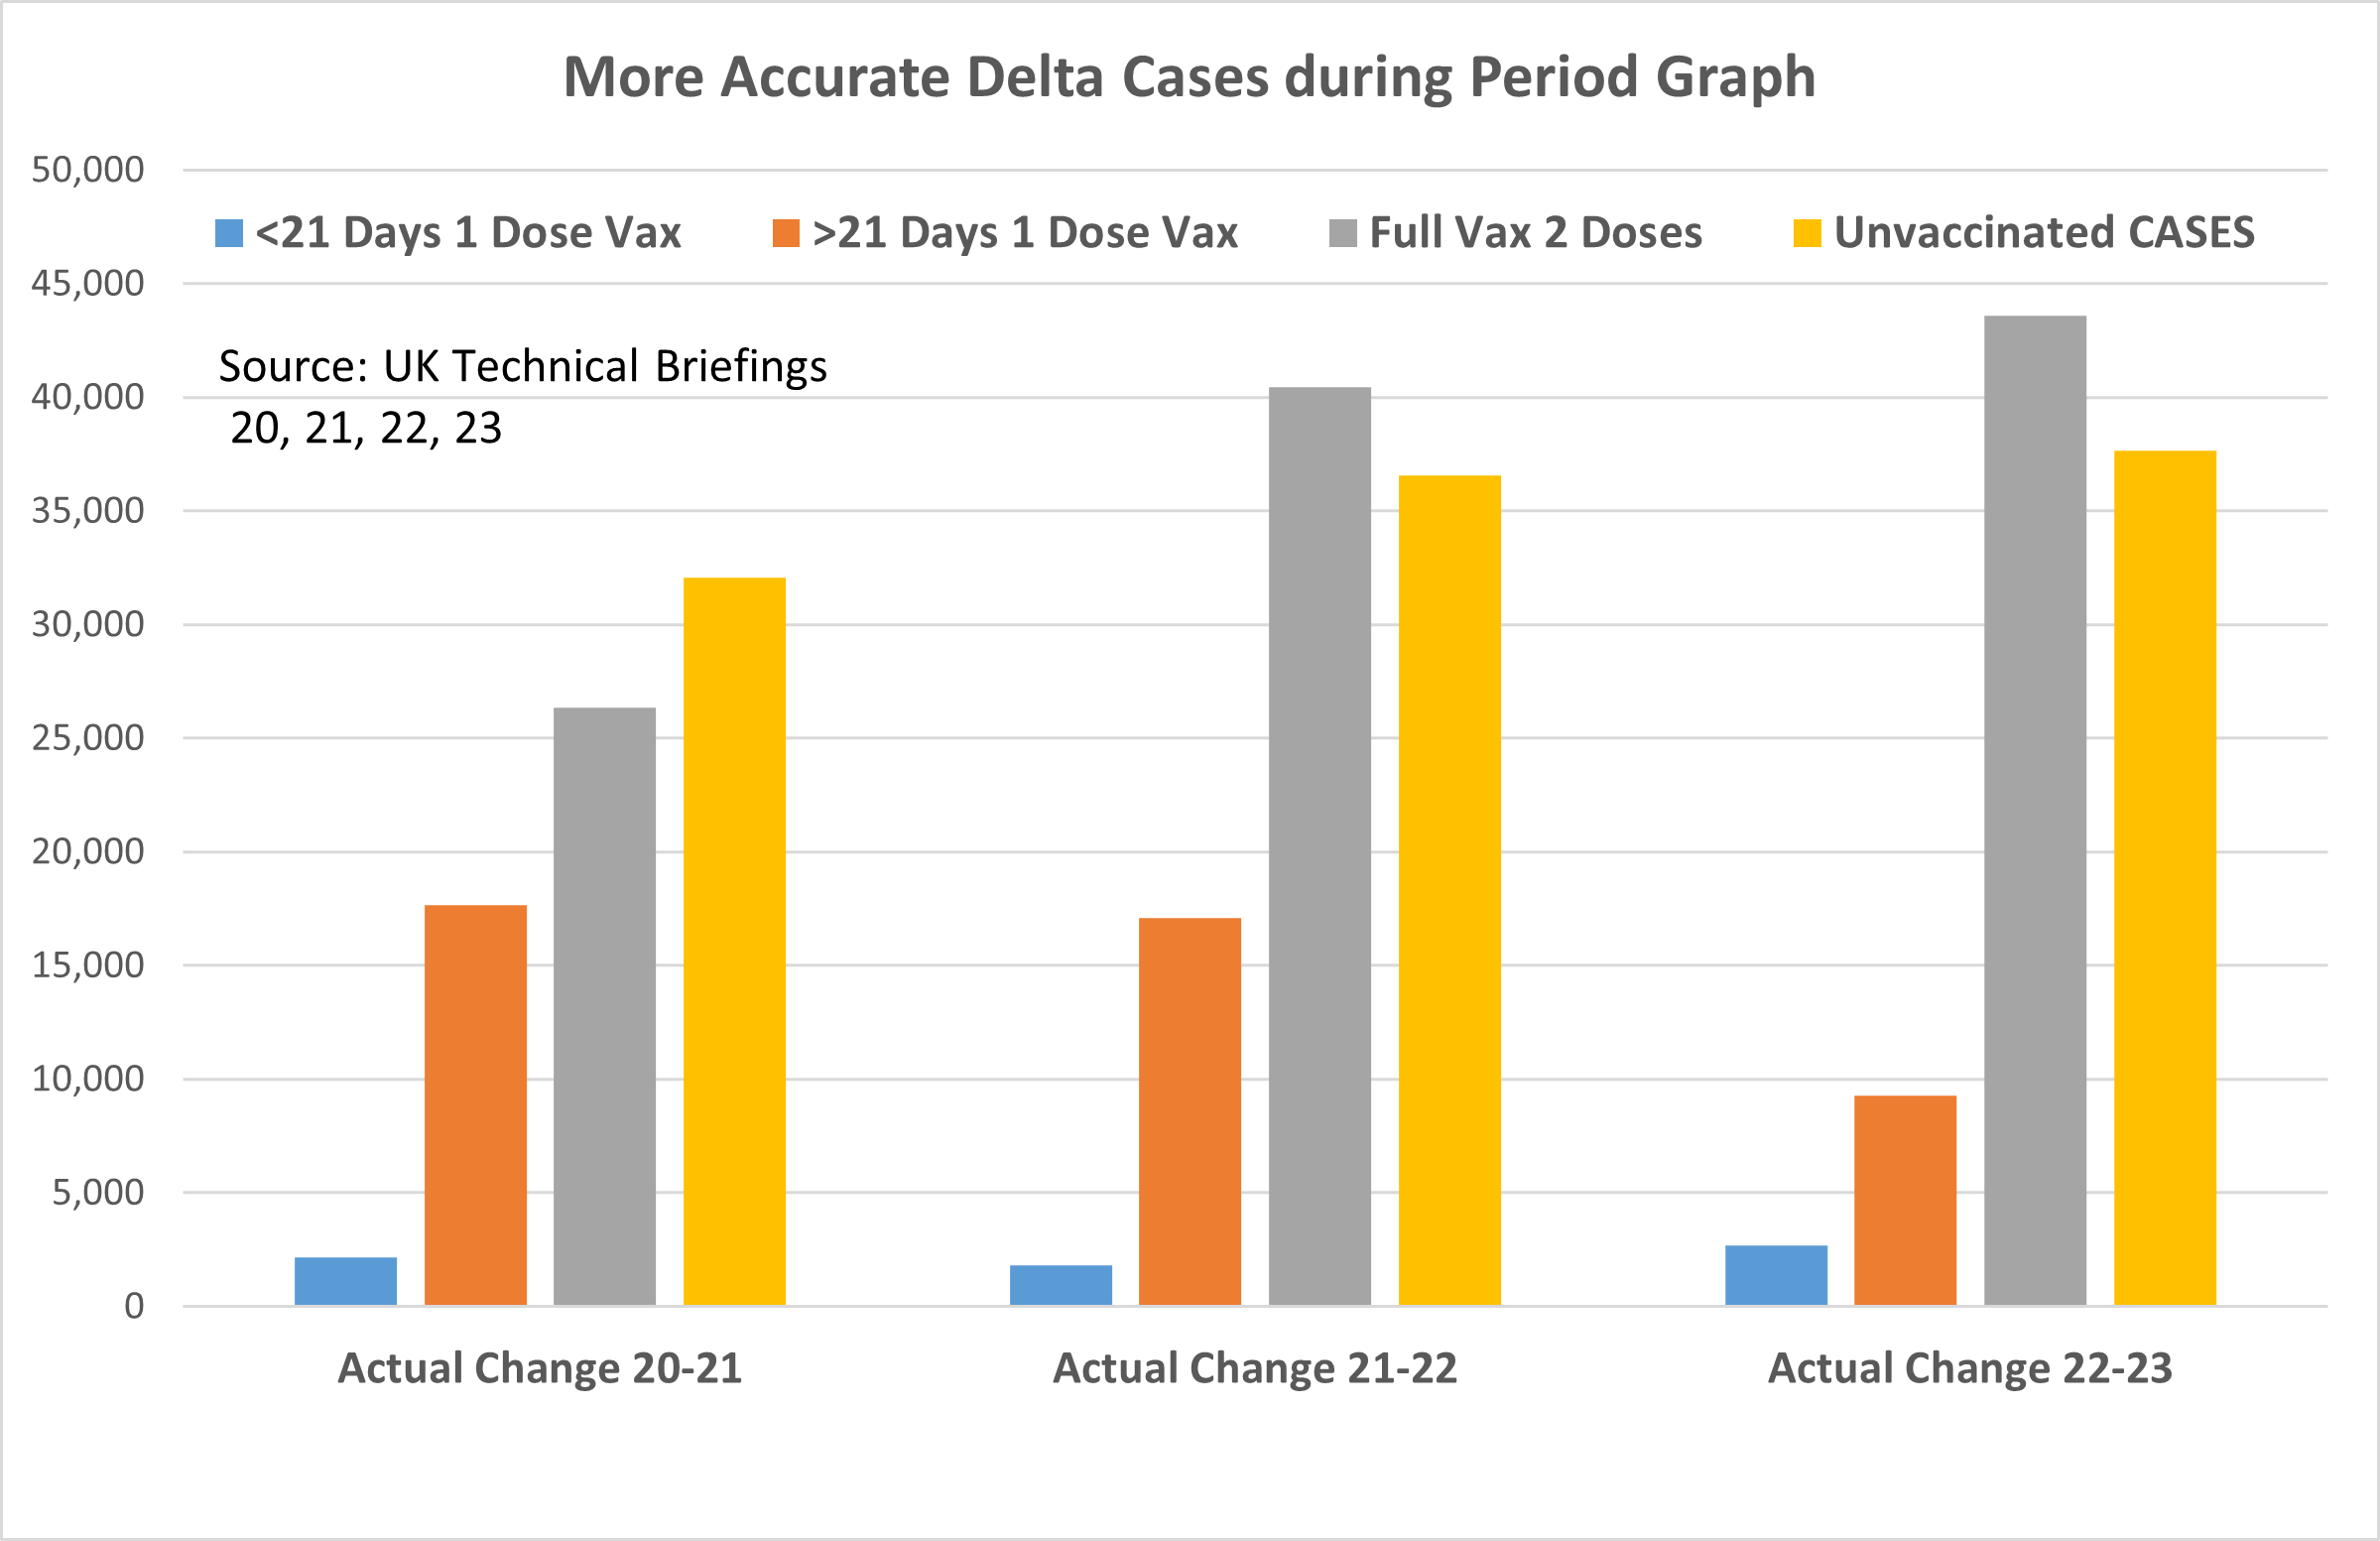
| The data below comes from COMPARING two reports. | |
|
Keys:
1.) This uses the exact same data, but shows the REAL change.
2.) This is still not optimal for understanding.
|
| The data below GROUPS all vaccinated together. | |
|
Keys:
1.) This uses the exact same data, But now it is clear that the MAJORITYof cases are from VACCINATED people.
2.) Better Decisions may be made from this information.
|
People over 50 have been vaccinated the longest in England.
What does the age 50+ data show?
Later you can see peer-reviewed published reports have predicted dangers like this.
Deaths of people over the age of 50 is chilling. They were vaccinated so they could feel "safe".
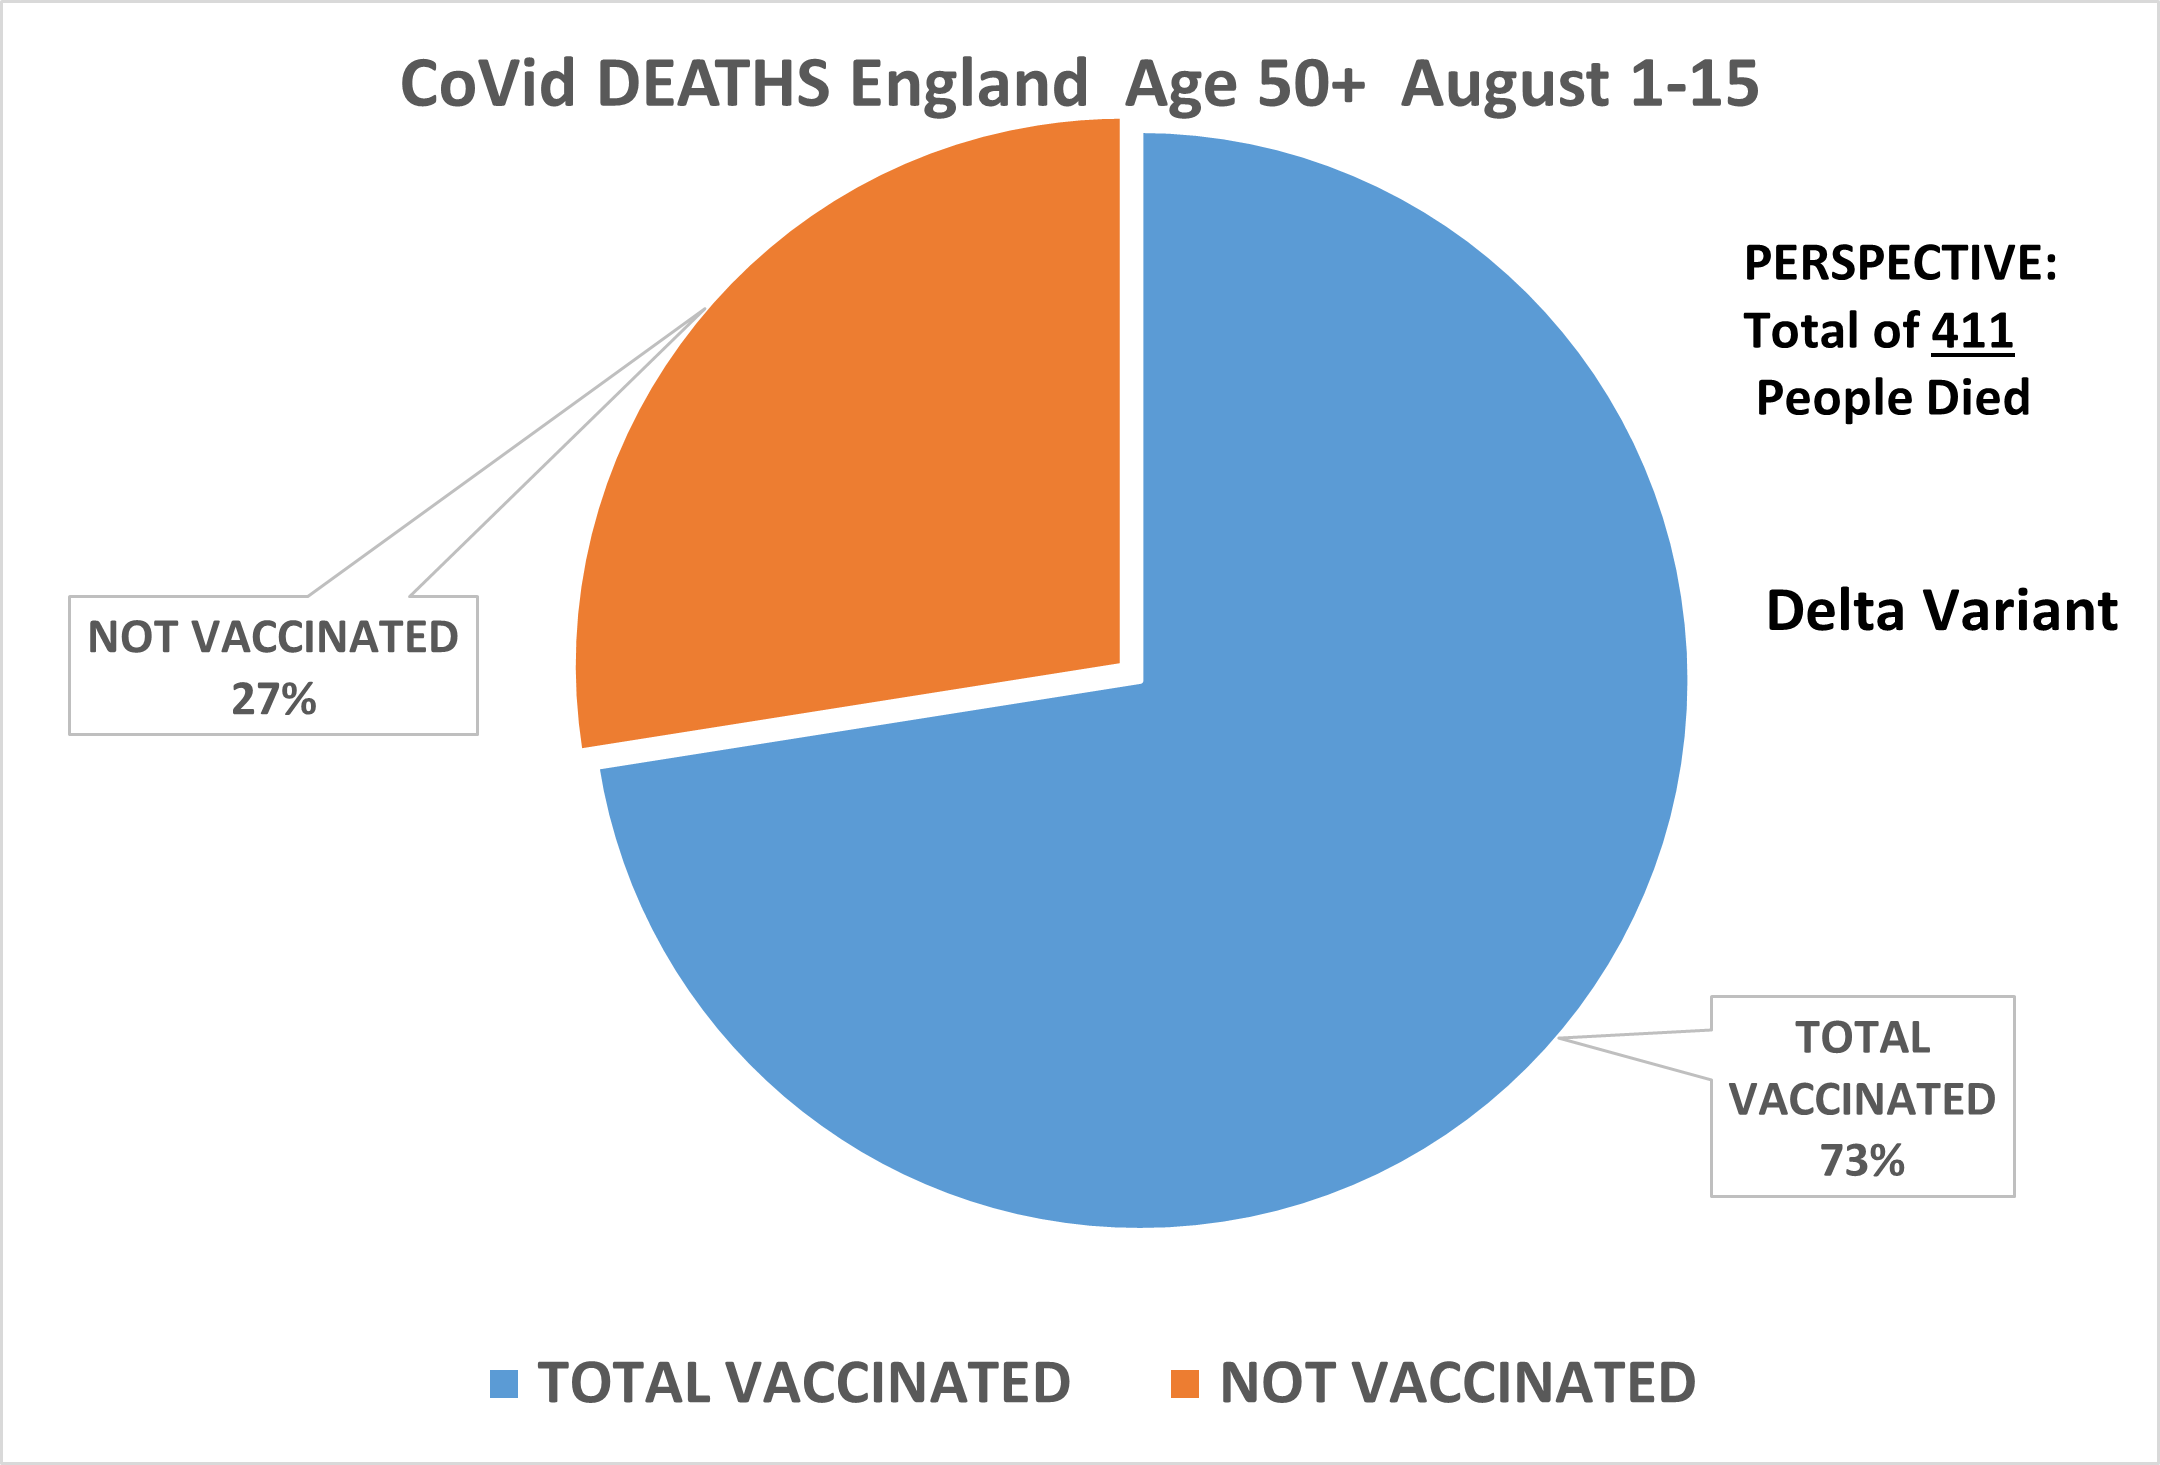
|
Keys:
1.) The
greatest percentages of Delta Variant deaths are from VACCINATED people.
2.) The percent of deaths from the unvaccinated was at 27%.
|
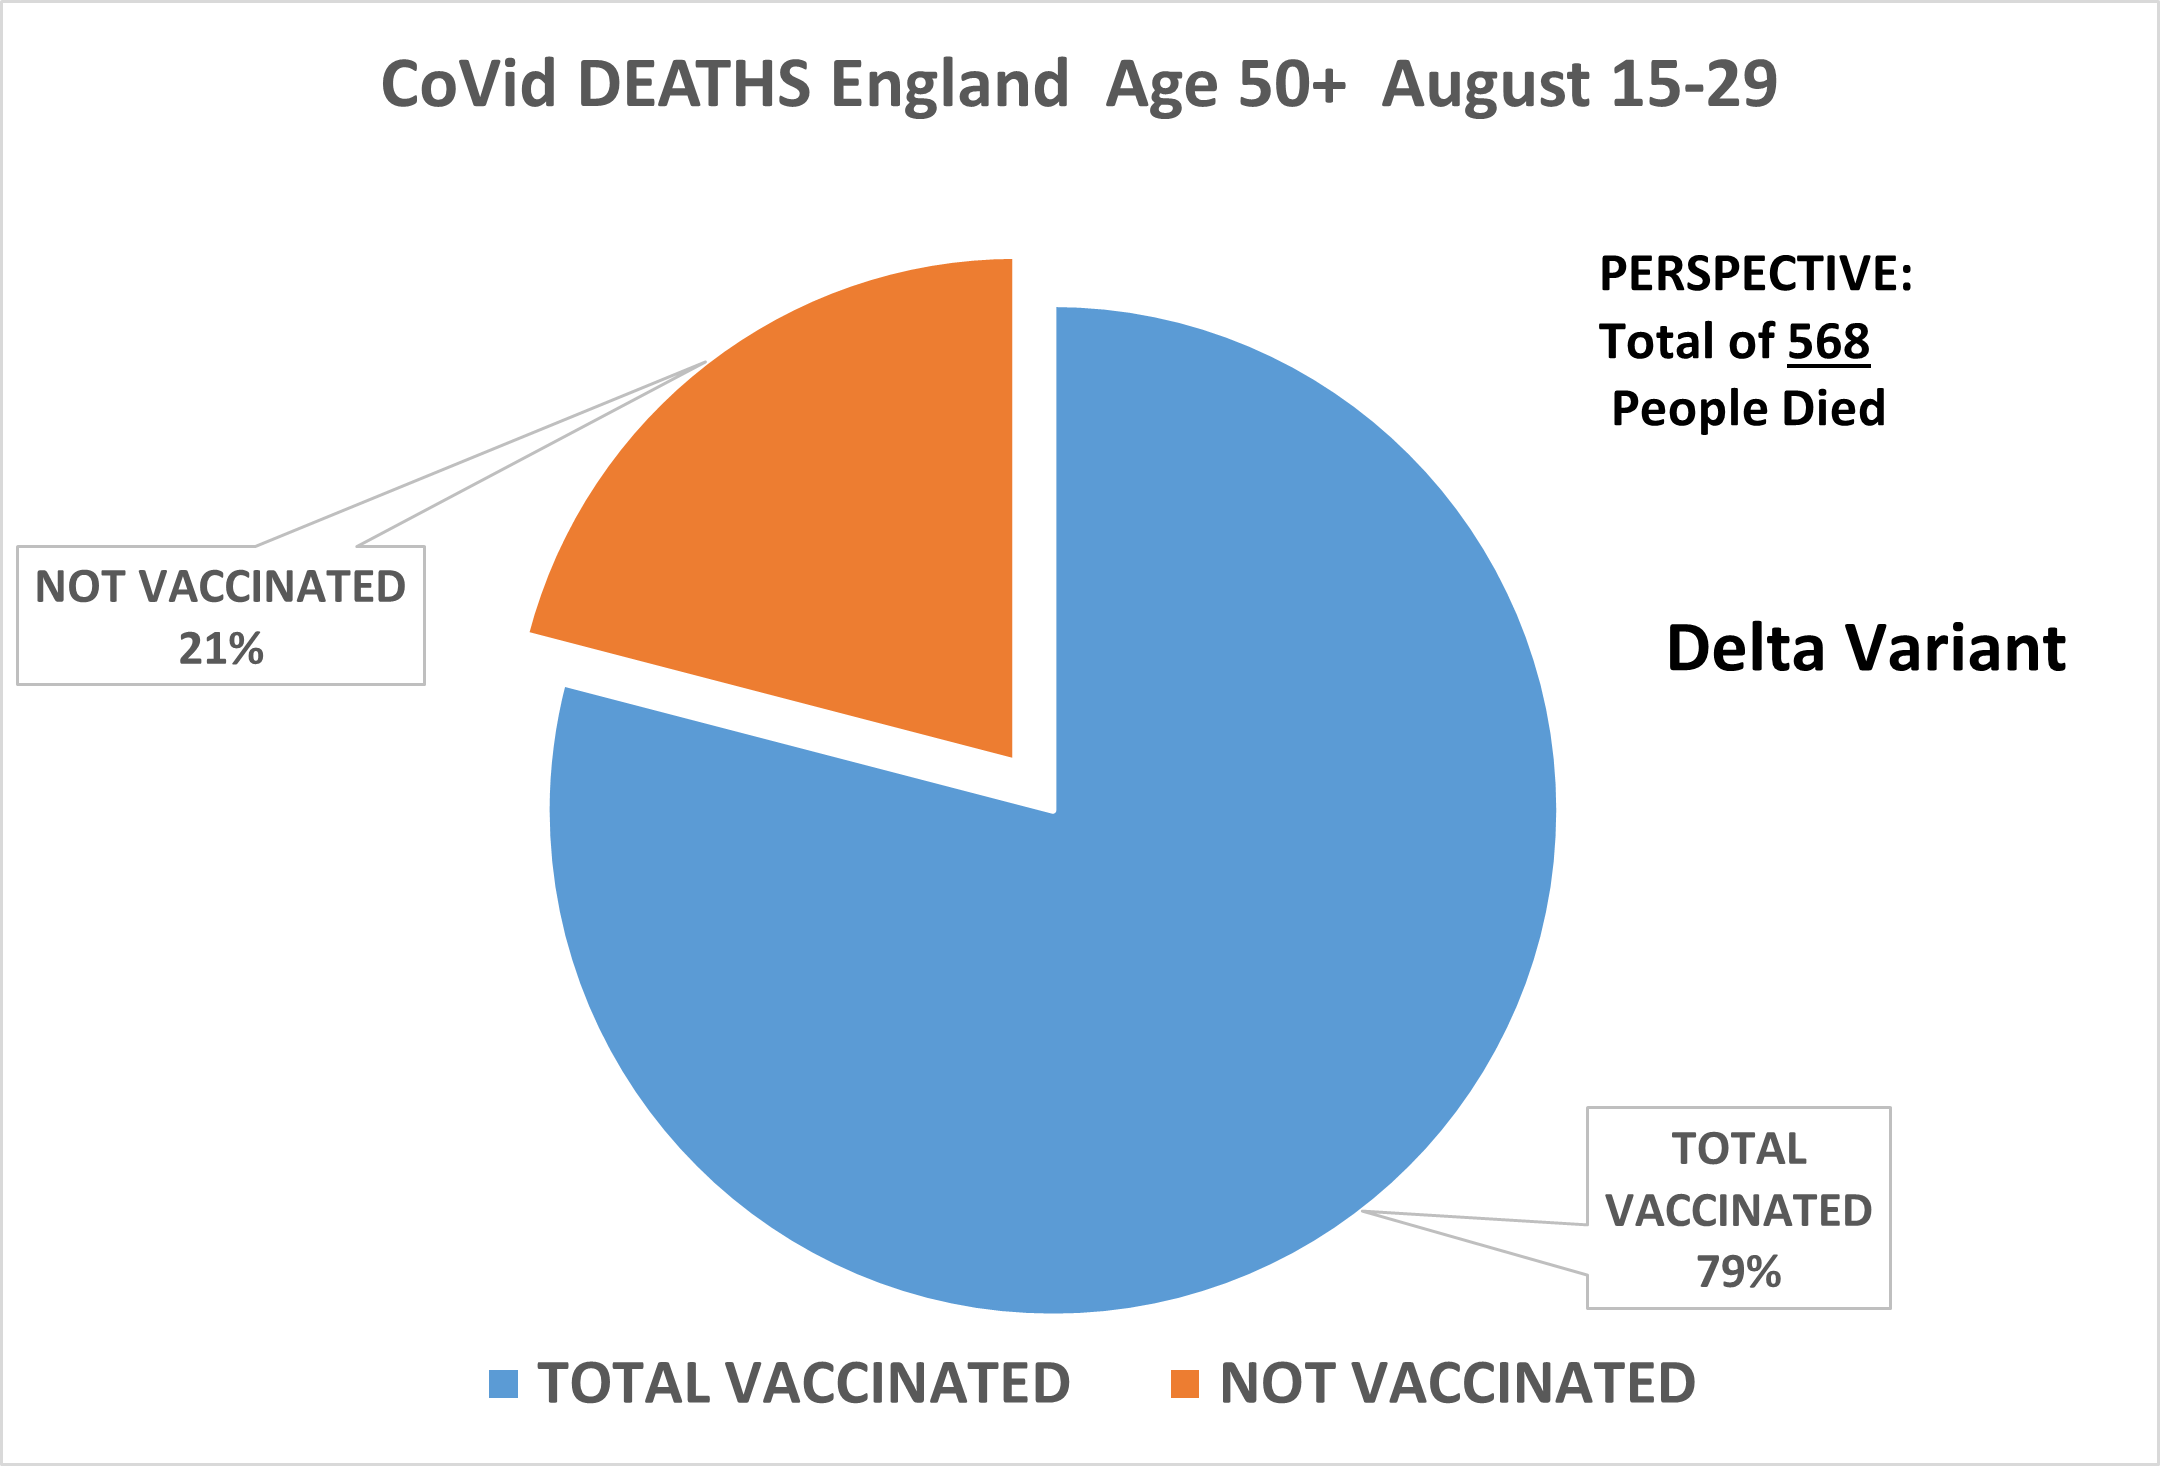
|
Keys:
1.) The
number of death has risen from the previous briefing along with the percent of deaths of VACCINATED people.
2.)The percent of deaths from the unvaccinated fell to 21%.
|
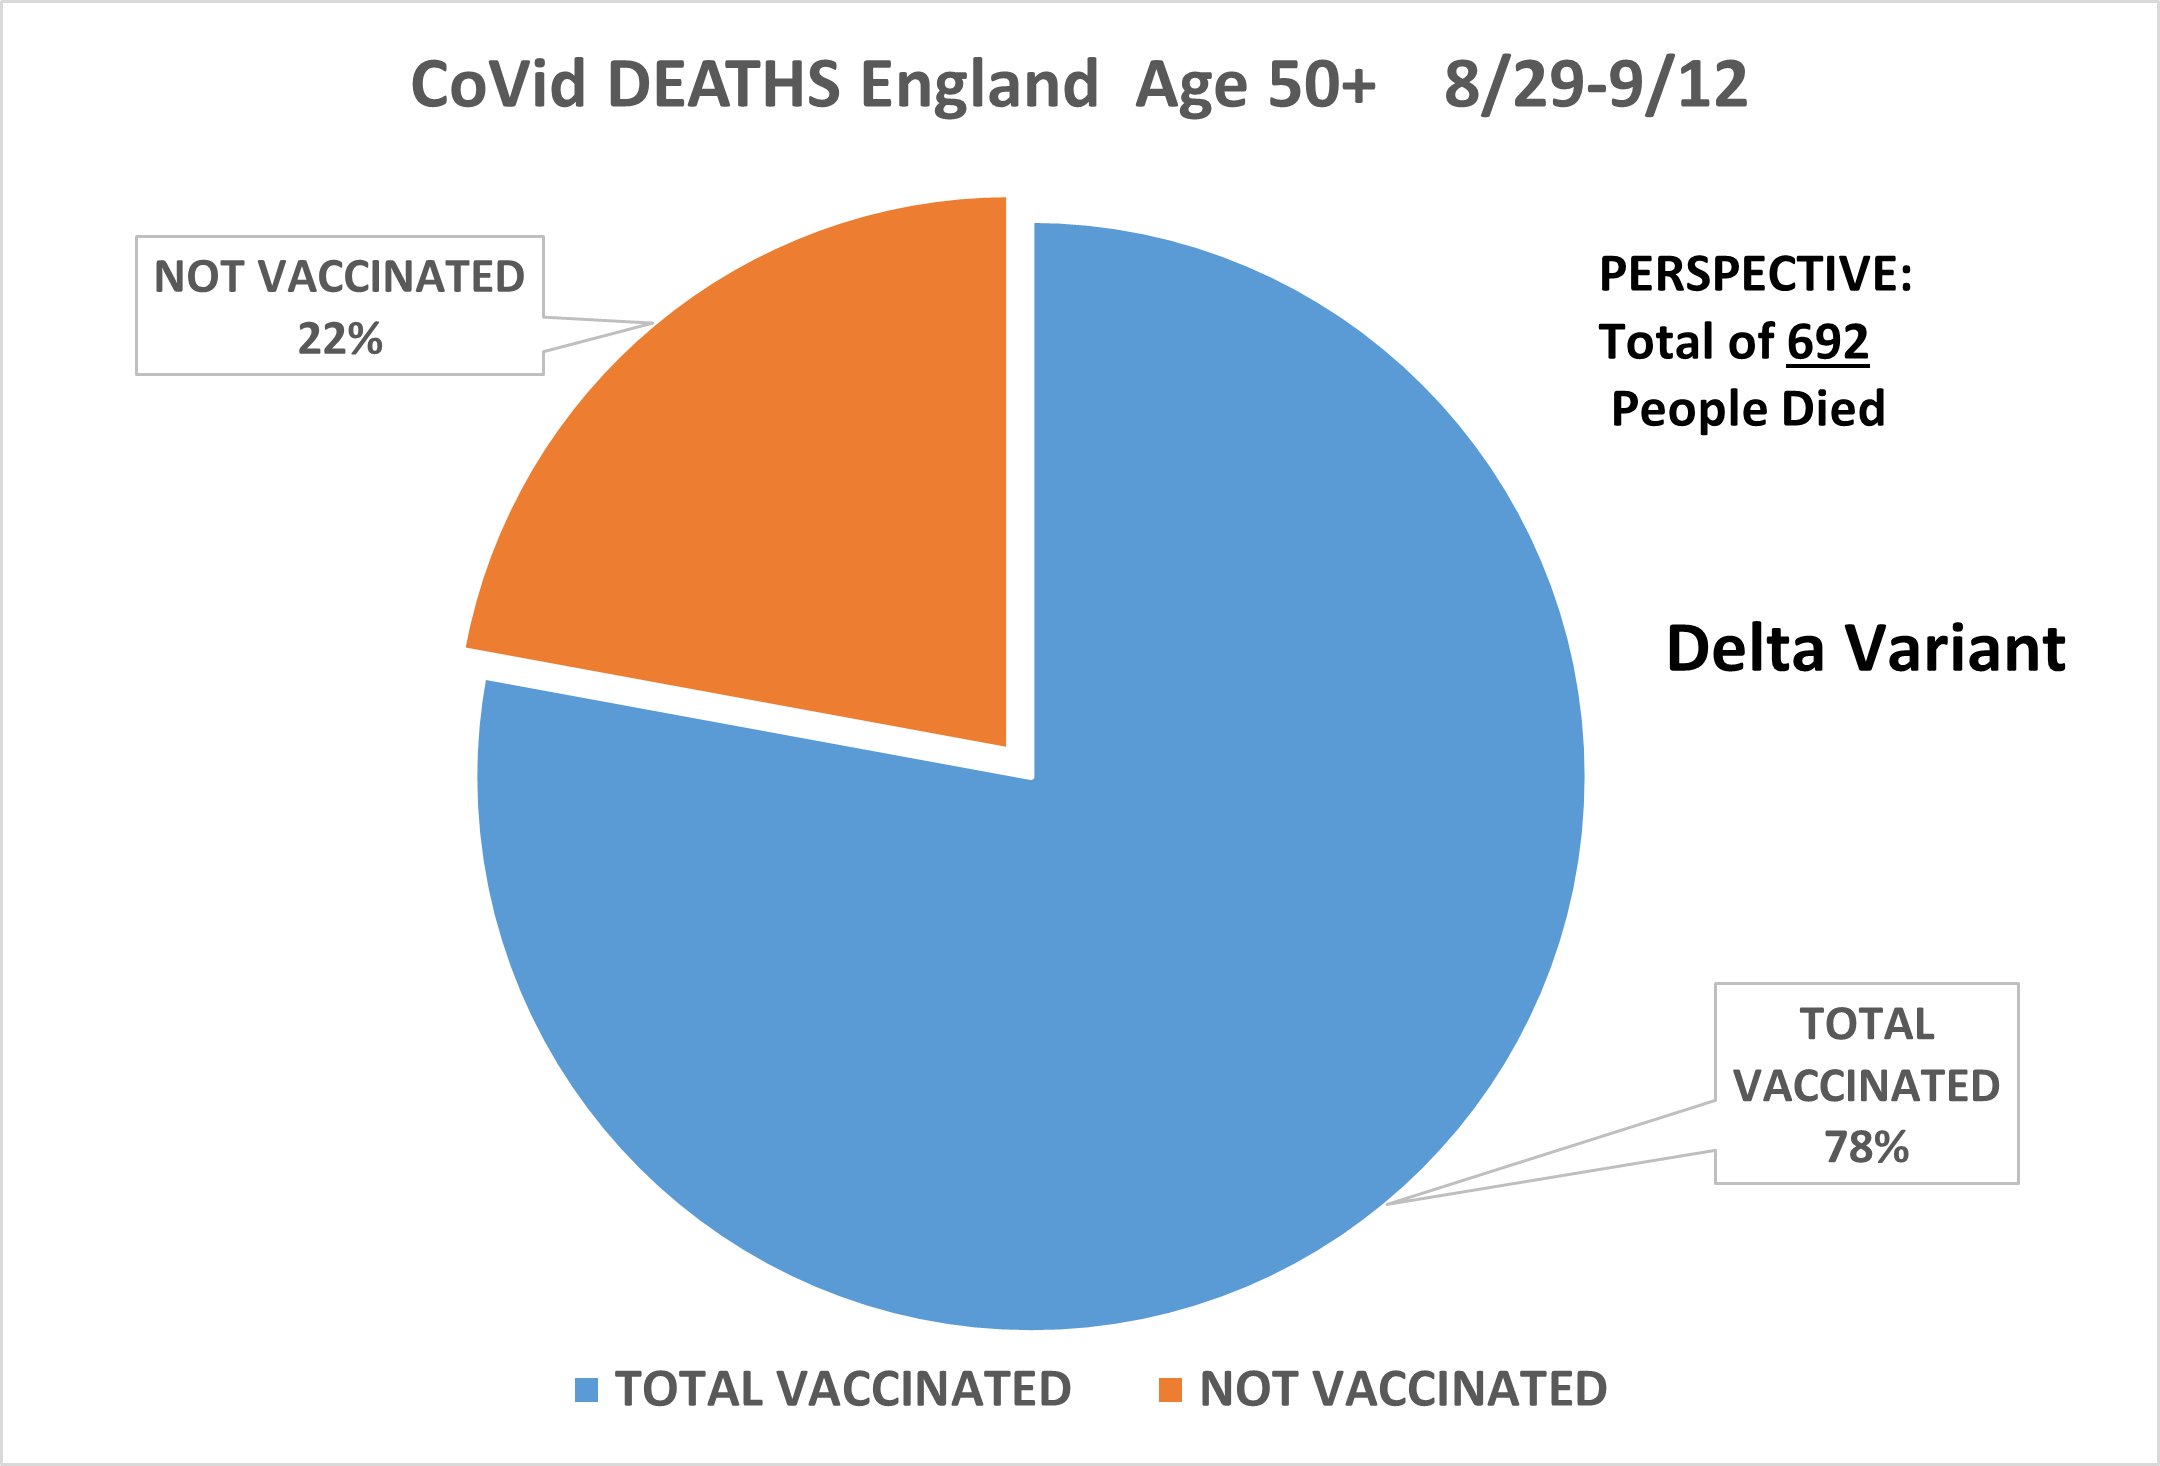
|
Keys:
1.) This data shows nearly 80% of the Covid Deaths in England during this period were VACCINATED people.
2.) This information is nearly identical to the results of the previous technical briefing.
|
|
Keys:
1.) This uses the exact same data, It clearly shows the Fully Vaccinated (two doses) account for 75% of the Covid Deaths.
2.) This helps dispel the rumor that single dose vaccinated people die more often.
|
| |
|
What about 18-49 year old people?
It is important to remember that people 18-49 ONLY had access to vaccination by mid-July 2021.
They may have been vaccinated for only a few weeks when these reports were published.
This means they would have been vaccinated for a few days before Technical Briefing 20,
and hardly more than a month before Technical Briefing 23.
| Shouldn't recently vaccinated people be safe? |
|
|
Keys:
1.) This data shows nearly half of the Covid Cases in those 18 - 49 years old in England during this period, were VACCINATED people.
2.) This information is consistent with previous technical briefings.
|
| |
|
How can you explain that the vaccinated are dying, when they should be "safe"?
Research in this area has been available for a number of years.
A few potential explanations for "some" aspect of the vaccinated deaths may be found below.
| Cytokine Storm | From Merriam-Webster : a sometimes life-threatening, systemic inflammatory condition that results from an aggressive immune response involving over-activation of immune cells
(such as T cells in response to immunotherapy or infection) which release excessive cytokines in the body in an uncontrolled fashion and that is characterized especially by fever, fatigue, headache, rash, or muscle or joint pain and may progress to more serious symptoms including hypotension, increased heart rate, capillary leakage, edema, hypoxia, multiple organ failure, and sometimes death. |
| Cytokine Storm is also referenced in Scientific Studies,that may help us understand the England Data Better. |
|
| Severe Pneumonia 2008 Study | Source: Journal of Immunology November 1, 2008 |
 |
KEY:
“The possible roles of host anti-SARS-CoV immune responses have been suggested in severe clinical cases. The uncontrolled release of immune mediators, called a “cytokine storm,” has been implicated in the pathogenesis of SARS.” |
| Lung Damage 2012 Study | Plosone.org April 20, 2012 (corrections August 2012) |
 |
KEYS:
“However, challenge of mice given any of the vaccines led to occurrence of TH-2 type immunopathology suggesting hypersensitivity to SARS-CoV components was induced. Caution in proceeding to application of a SARS-CoV vaccine in humans is indicated ”
From the study: "Challenge" means to be exposed to the virus in it's "wild state", such as a variant .
|
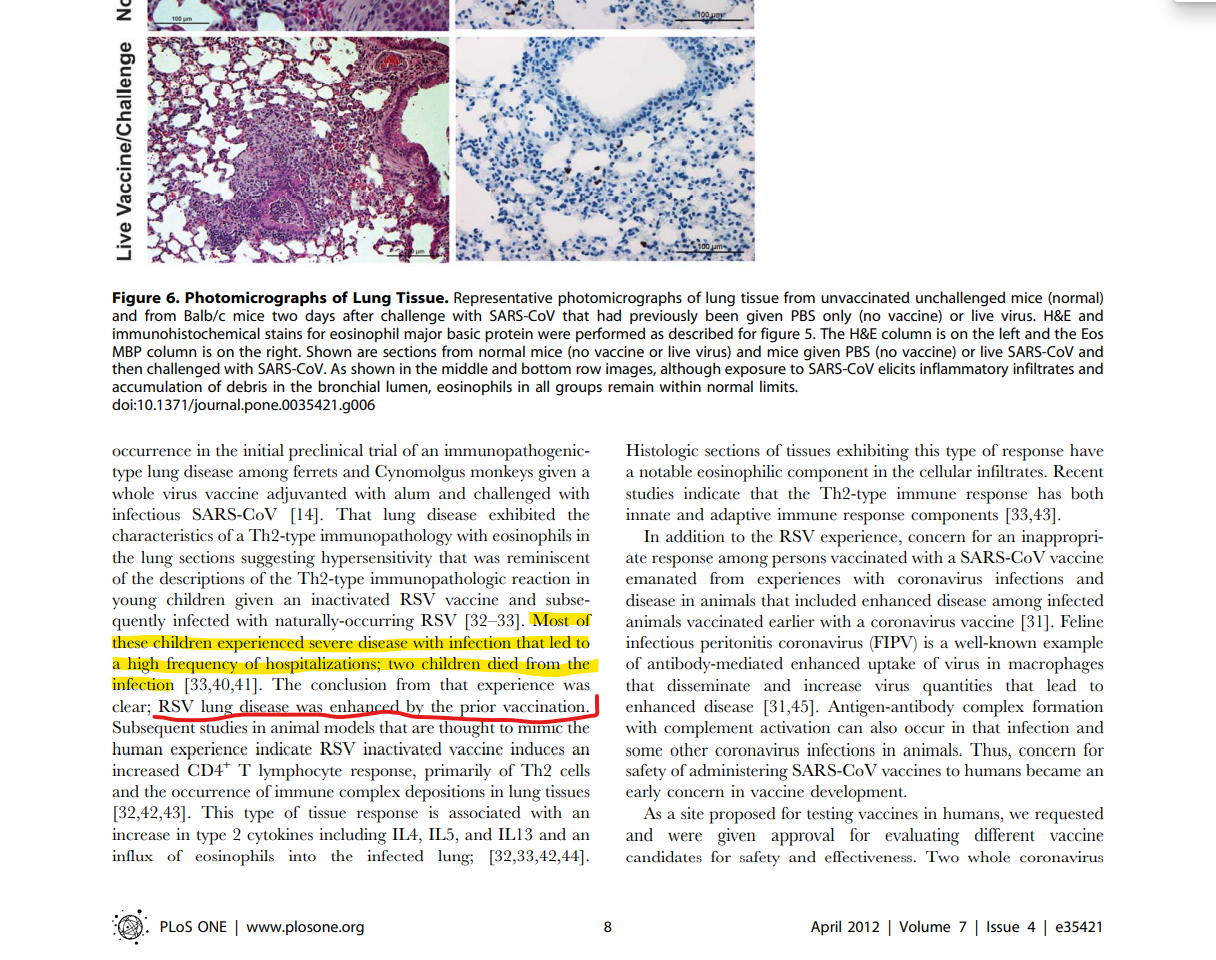
| Key:
"RSV lung disease was enhanced by the prior vaccination" |
| |
| Liver Damage 2004 Study |
Journal of Virology November 2004 |
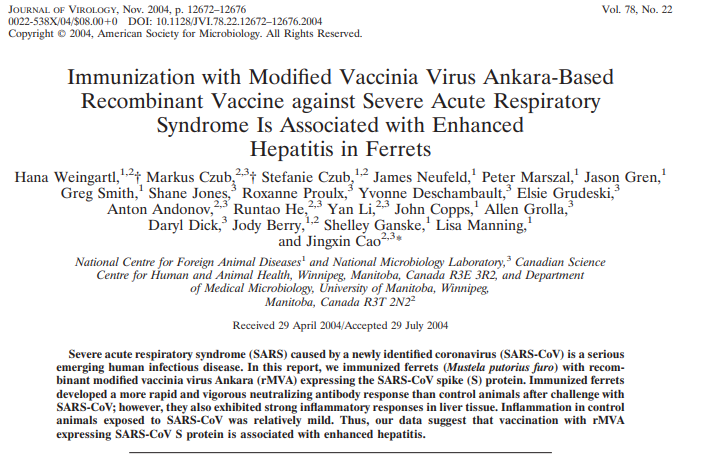 |
Key:
"Vaccination with rMVA expressing SARS-CoV is associated with enhanced hepatitis" |

| KEYS:
Challenged by live virus as in other studies
“vaccination
with the SARS-CoV S may lead to enhanced liver damage following SARS-CoV infection”
From the study: "Challenge" means to be exposed to the virus in it's "wild state" such as a variant .
|
What is next?
You can gather the information yourself. This website has given you a start.
There are many more variants the UK is currently tracking.
Don't just believe what you are told: check for yourself.
| Here is the list of the variants the UK is currently tracking. Each one could be counted as a "Wild Virus" that could "Challenge" the vaccinated. |
|
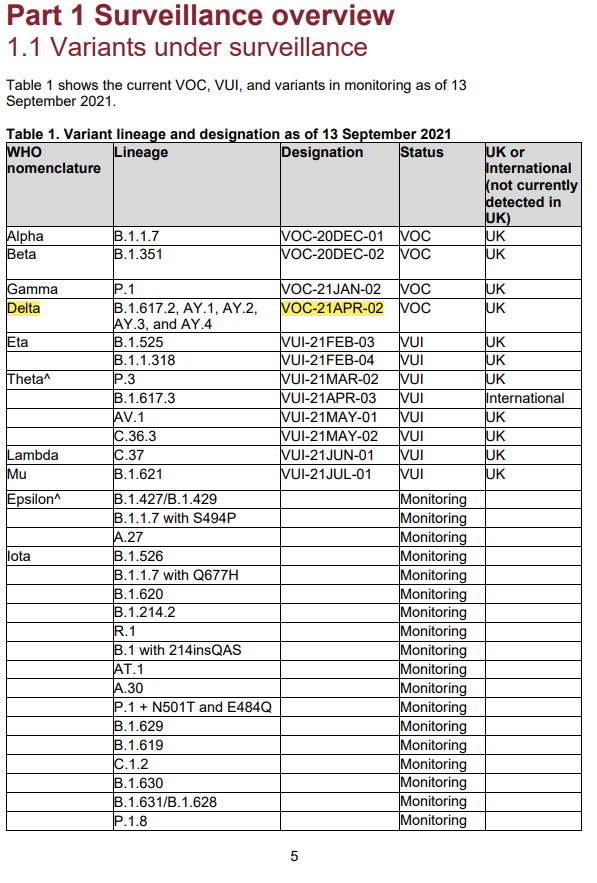
| KEYS:
There are many more variants to analyze.
Vaccinated people may be "Challenged" by live virus as in other studies.
From the studies: "Challenge" means to be exposed to the virus in its "wild state" such as a variant.
|
| |
|
| |
|
| |
|
| |
|
.
Stay Vigilant !